


- The total cryptocurrency market cap stood at $1.05 trillion following a 0.35% drop in the past 24 hours.
- Chart patterns for SEI, SOL, FTM, AXS, and OP suggest these altcoins will experience large price moves.
- SEI was the biggest 24-hour loser and was trading at $0.1458 following a 24-hour loss of more than 5%.
The global cryptocurrency market cap slipped 0.35% during the last day of trading. As a result, the total was estimated to be $1.05 trillion at press time, according to CoinMarketCap. Following the sharp drop in cryptocurrency prices last week, many traders and investors will begin looking for trade opportunities for the coming month in an attempt to move on from the market crash.
5 cryptocurrencies that are showing promising signs for substantial gains this September are Fantom (FTM), Optimism (OP), Axie Infinity (AXS), Sei (SEI) and Solana (SOL). Technical indicators on these altcoins’ charts suggested that the cryptocurrencies may experience substantial price movements in the coming weeks.
Fantom (FTM)
CoinMarketCap indicated that FTM was changing hands at $0.2076 at press time. This was after the cryptocurrency suffered a 24-hour loss of 1.44%. This negative daily performance pushed FTM’s weekly performance further into the red zone to -13.90%. Furthermore, the latest price movement resulted in FTM’s market cap totaling $580,495,383.
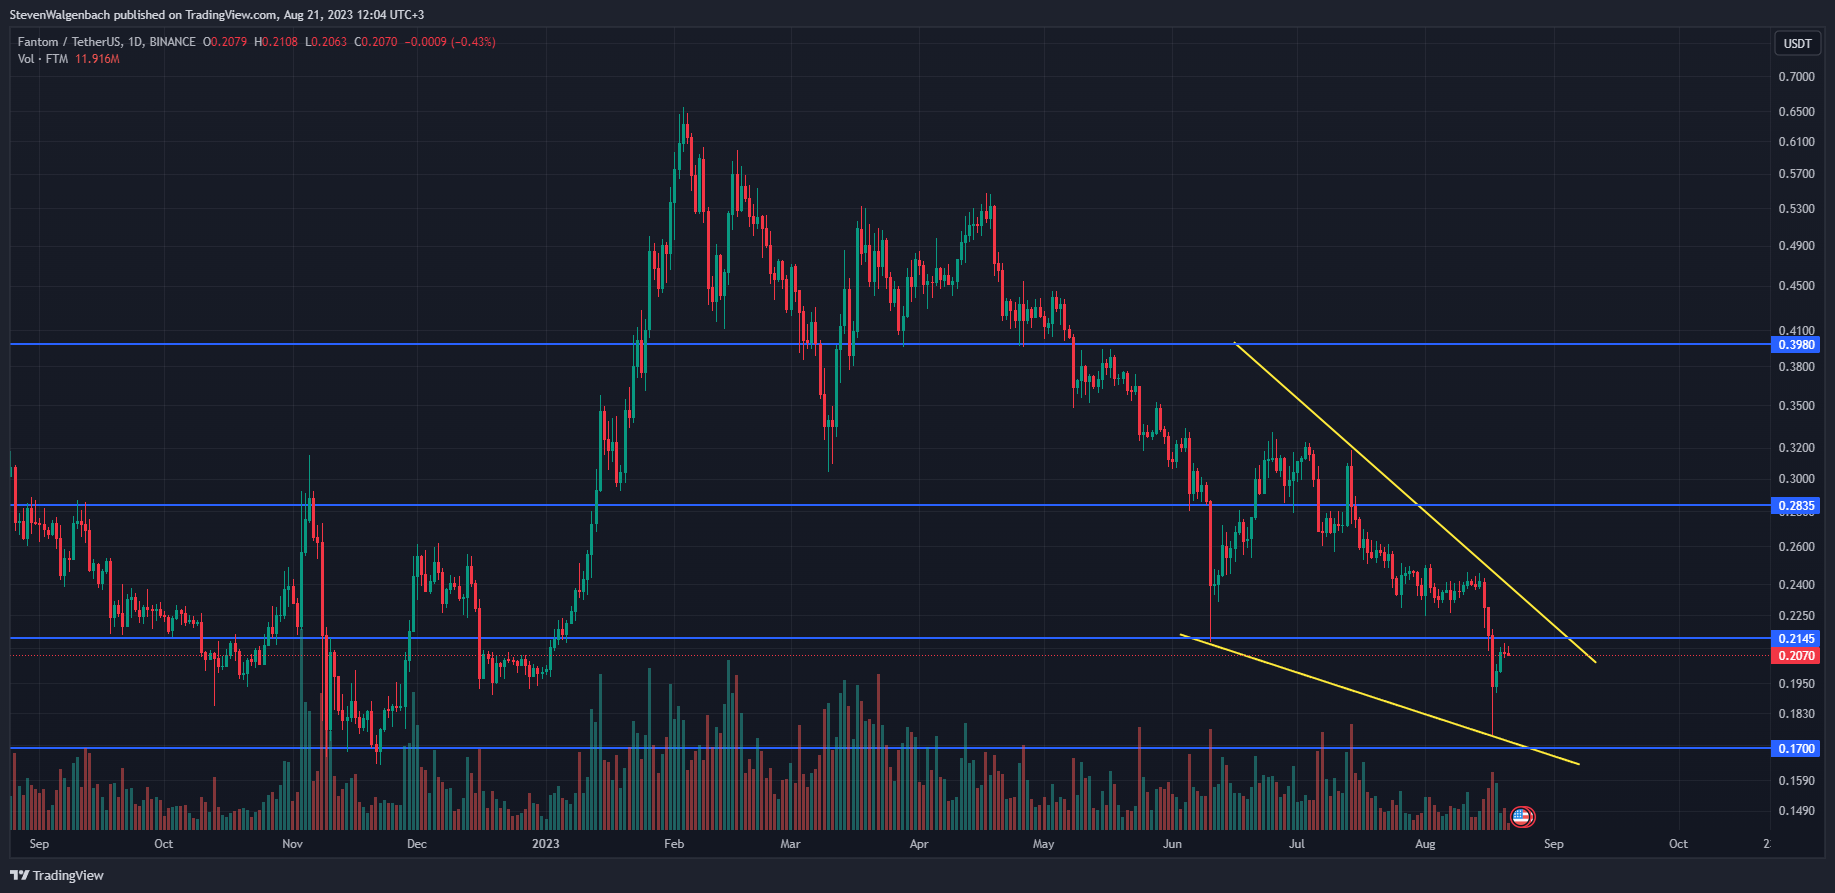
A bullish pattern had formed on FTM’s daily chart over the past few weeks. At press time, there was a falling wedge chart pattern present on the altcoin’s chart, which suggested that FTM’s price may enter into a short-term rally within the next 2 weeks.
If this chart pattern is validated, then FTM’s price may rise to as high as $0.2835 through the course of September and early October. Depending on the amount of buy pressure that enters FTM’s chart during the upcoming couple of weeks, the altcoin’s price may even attempt to challenge the major resistance level at $0.3890.
A confirmation of this bullish thesis will be when FTM’s price closes 3 consecutive daily candles above $0.2145. Conversely, failure to close above this threshold within the next 72 hours will put the altcoin at risk of dropping to the next crucial support level. In this scenario, FTM’s price could fall to as low as $0.17 in the next 2 weeks.
Axie Infinity (AXS)
AXS also saw its price drop during the past day of trading. At press time, the price of AXS stood at $4.91 after it had slipped 0.62%. Despite the decrease in price, AXS did record a 7.89% uptick in its daily trading volume – boosting the total to $15,581,823. The drop in the altcoin’s price suggested that the majority of this trading volume was sell volume.
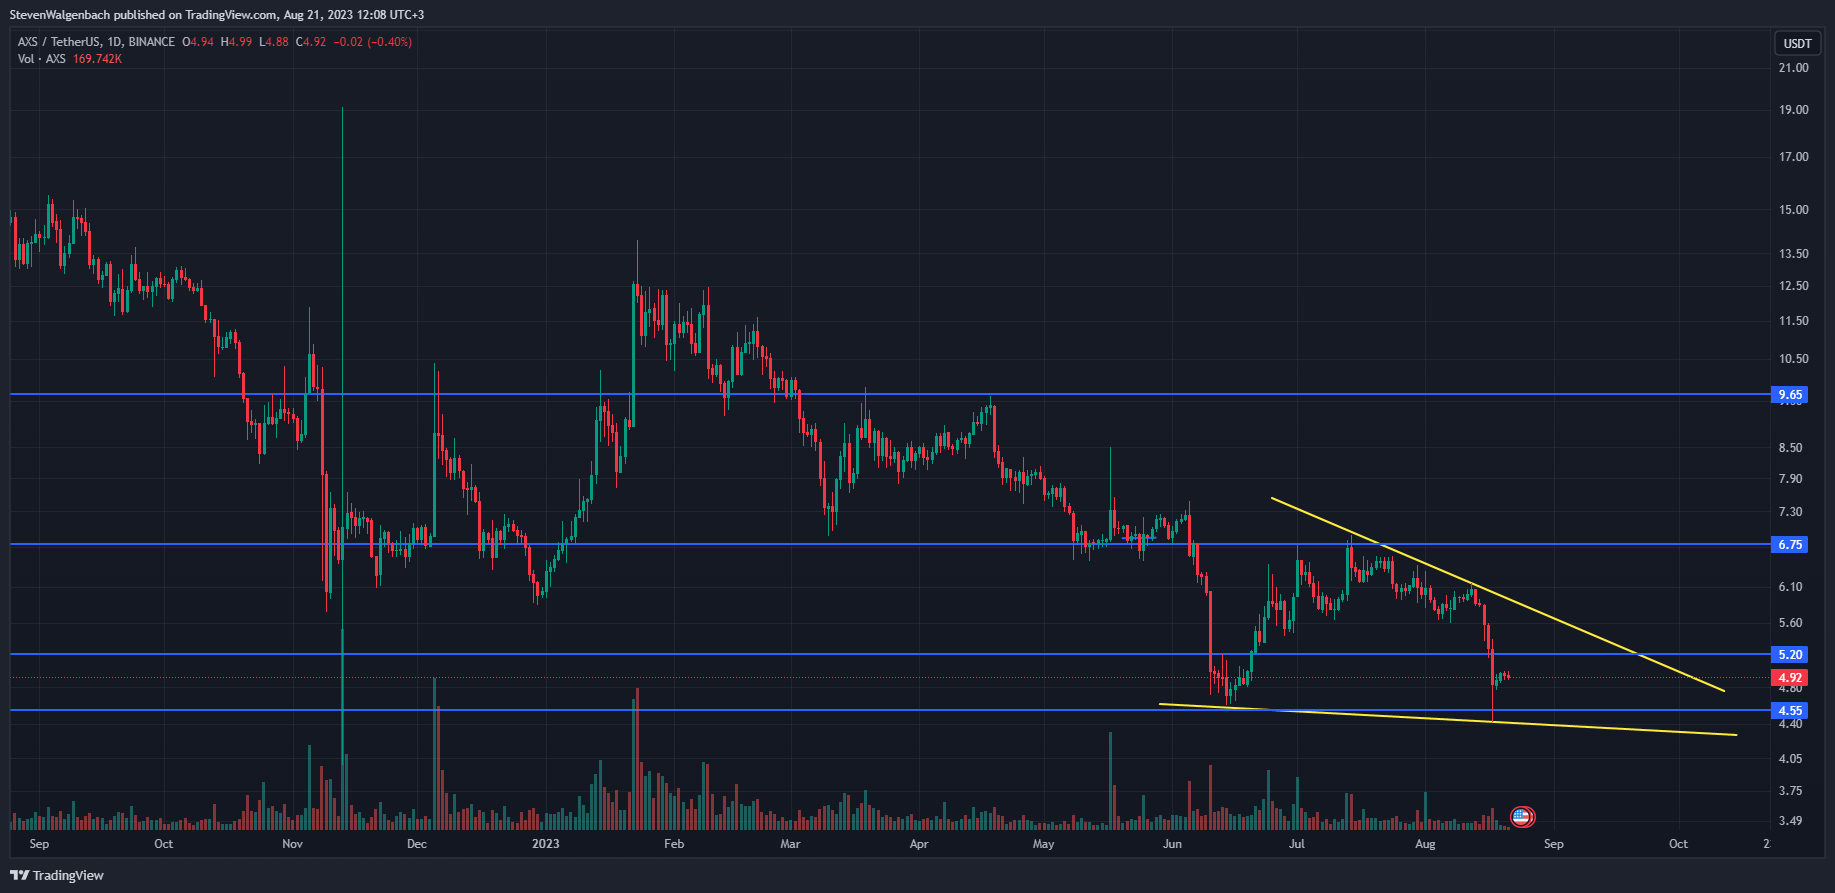
Similar to FTM, a bullish falling wedge chart pattern had also formed on the daily chart for AXS. If validated, the altcoin’s price could ascend to $6.75 throughout September. A confirmation of this bullish thesis will be when AXS closes a daily candle, and sustains a position, above the $5.20 resistance level.
This will then clear a path for the cryptocurrency’s price to climb to $6.75 in the following 2 weeks. Thereafter, a break above $6.75 may be followed by AXS rising to $9.65 if buyers continue to drive the cryptocurrency’s price.
This bullish thesis will be invalidated, however, if AXS fails to close a daily candle above $5.20 within the next week. This may then result in the cryptocurrency’s price falling to the crucial support level at $4.55.
Optimism (OP)
OP was able to post a 24-hour gain of 1.71%. Subsequently, the cryptocurrency’s price stood at $1.49 at press time. This latest price increase was not enough to bring OP’s weekly performance out of the red zone. Consequently, OP was still down more than 4.5% for the week.
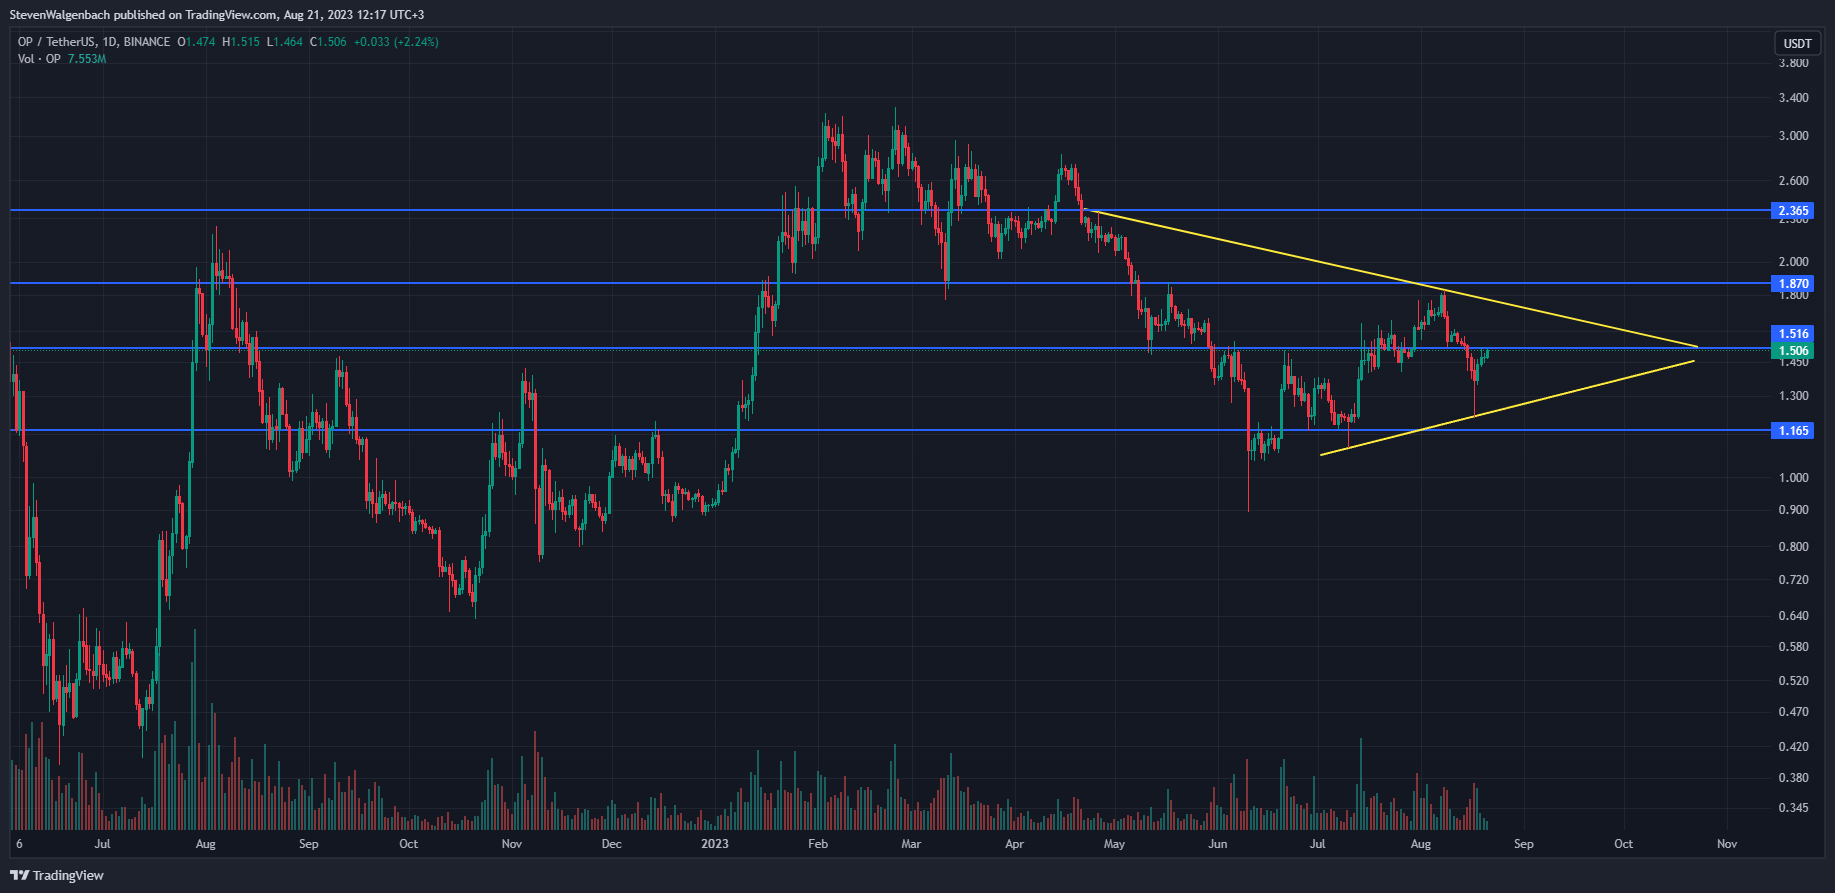
A breakout in OP’s price in the coming couple of weeks may be imminent as a symmetrical triangle chart pattern had formed on the altcoin’s daily chart. Furthermore, the cryptocurrency’s price was attempting to overcome the resistance level at $1.516 at press time.
If it closes today’s trading session above this price point, then it may look to climb to the next significant resistance level at $1.870 in the coming week. A break above this barrier will serve as a confirmation of a bullish breakout.
This could result in OP reaching a high of $2.365 in the following few days. However, a rejection from the $1.516 resistance may lead to OP’s price dropping to the crucial support level at $1.165.
Sei (SEI)
SEI was the biggest loser of the 5 cryptocurrencies with its 24-hour loss of more than 5%. As a result, the altcoin was trading at $0.1458 at press time. This also placed SEI’s price closer to its 24-hour low of $0.1456 than its daily high which stood at $0.1553.
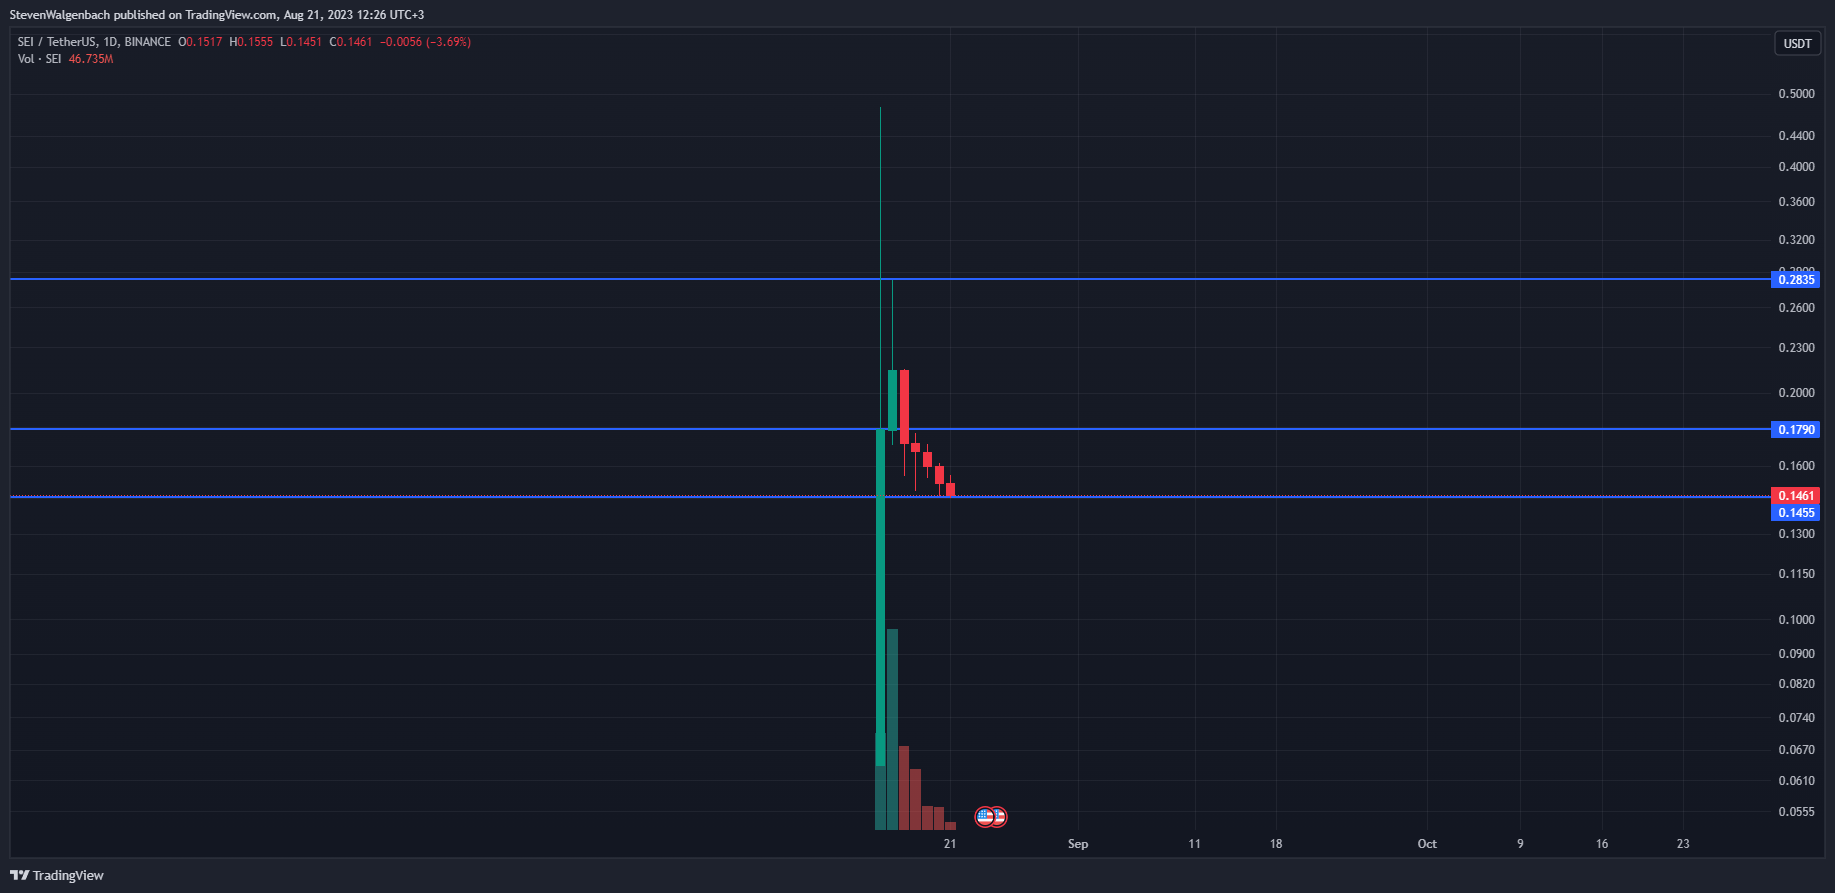
SEI’s price skyrocketed from its listing price of $0.0640 to a high of $0.4800 on 15 August 2023. It then pulled back to close the daily trading session off at $0.1789. In the 24 hours that followed, traders gave the altcoin’s price a boost – elevating it to a high of $0.2830. Once again, SEI’s price retraced to close the trading session at $0.2148.
Since then, SEI’s price has been in a gradual decline as early-stage investors continued to take profit. Consequently, the cryptocurrency was at risk of dropping below yesterday’s 24-hour low of $0.1455 during today’s trading session.
If savvy investors and traders identify the altcoin’s current level as a buy opportunity, then SEI’s price may reclaim a position back above $0.1790. Thereafter, the cryptocurrency will have a clear path to rise to the next significant price point at $0.2835. Conversely, if SEI fails to close today’s trading session above today’s open price at $0.1517, then it may continue its decline.
Solana (SOL)
Lastly, SOL suffered the same fate as the majority of the cryptocurrency market and experienced a 2.75% drop in its price throughout the past 24 hours. This resulted in the Ethereum-killer trading hands at $21.25 at press time.
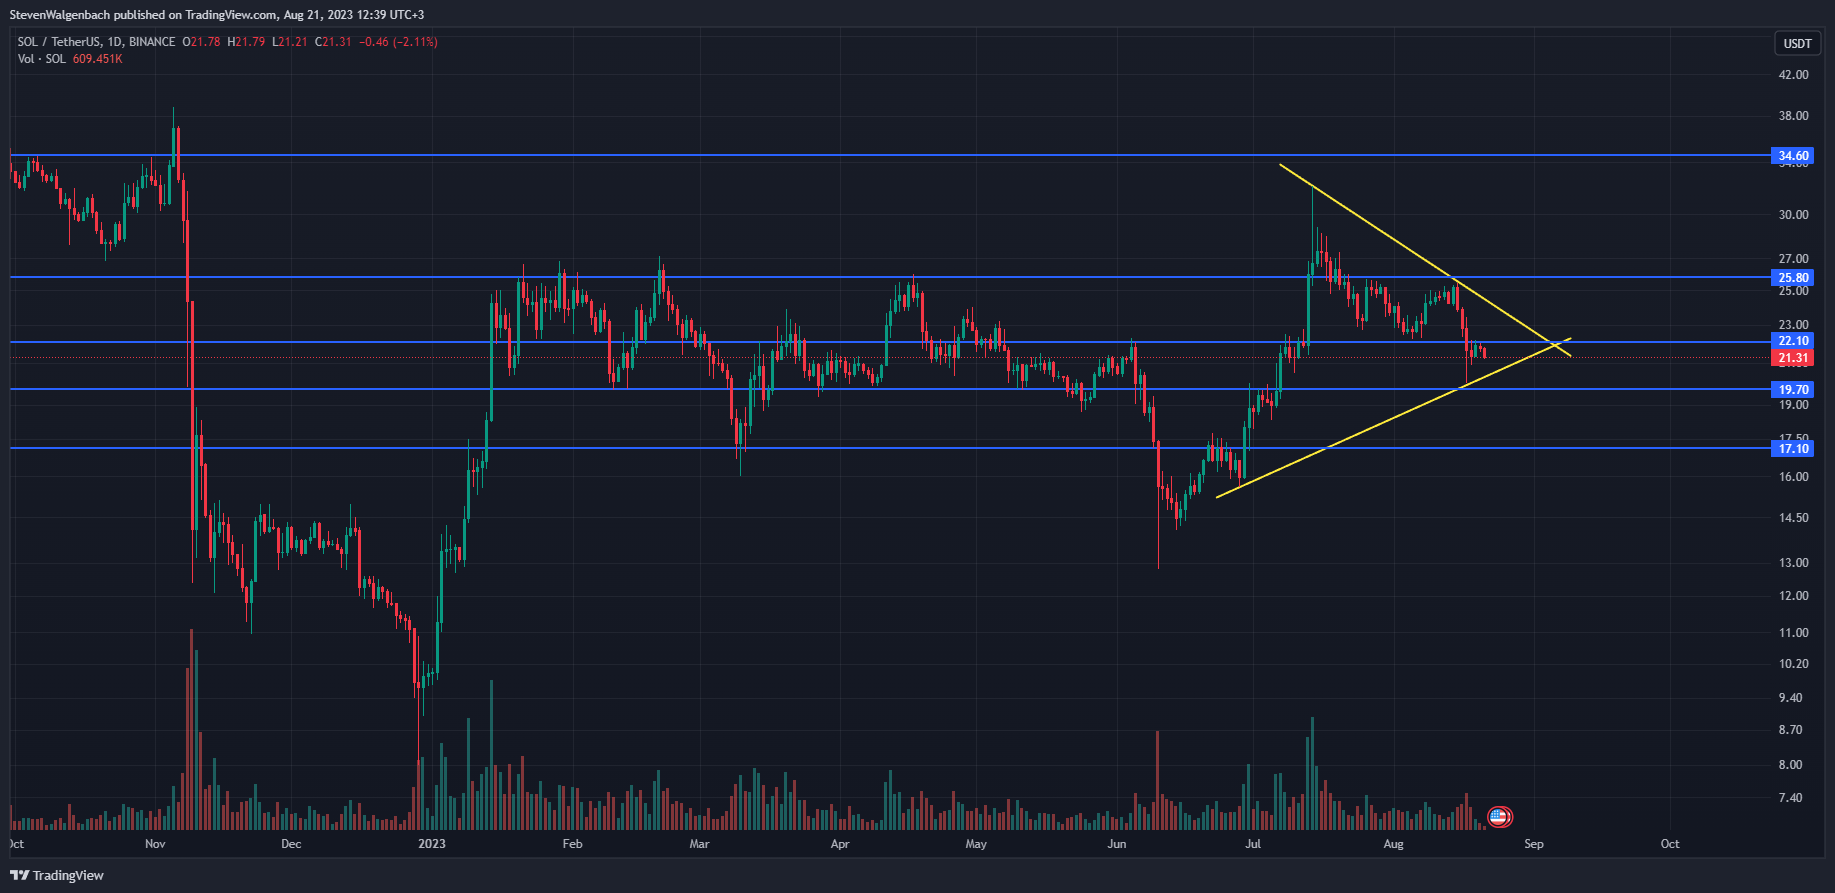
A symmetrical triangle chart pattern was present on SOL’s daily chart at press time. This suggested that a drastic price move was in the cards for the Ethereum-killer in the coming couple of weeks.
If this breakout is towards the downside, then SOL’s price could retest the $19.70 support level. Continued sell pressure at this point may then also drag the cryptocurrency’s price down to the crucial support level at $17.10 in the following few days.
On the other hand, should SOL enter into a bullish breakout, then it may attempt to challenge the $25.80 resistance level. A break above this point will then pave a way forward for SOL’s price to rise to $25.80 this September. A potential early indication of the bullish breakout could be when SOL’s price closes a daily candle above $22.10.
Disclaimer: The views and opinions, as well as all the information shared in this price analysis, are published in good faith. Readers must do their own research and due diligence. Any action taken by the reader is strictly at their own risk. Coin Edition and its affiliates will not be held liable for any direct or indirect damage or loss.
Disclaimer: The information presented in this article is for informational and educational purposes only. The article does not constitute financial advice or advice of any kind. Coin Edition is not responsible for any losses incurred as a result of the utilization of content, products, or services mentioned. Readers are advised to exercise caution before taking any action related to the company.


