


- Waves price analysis is bearish for today.
- The WAVE coin is currently stuck in a descending triangle formation.
- Support for Waves is present at $1.0.
Waves price analysis shows a bearish continuation as the bulls struggle to regain momentum in the market. The price is currently trading below the $1.5 support level and looks vulnerable to further losses if this level fails to hold up. The technical indicators are also bearish for Waves, indicating that the sellers have a stronger bias over buyers in the near term.
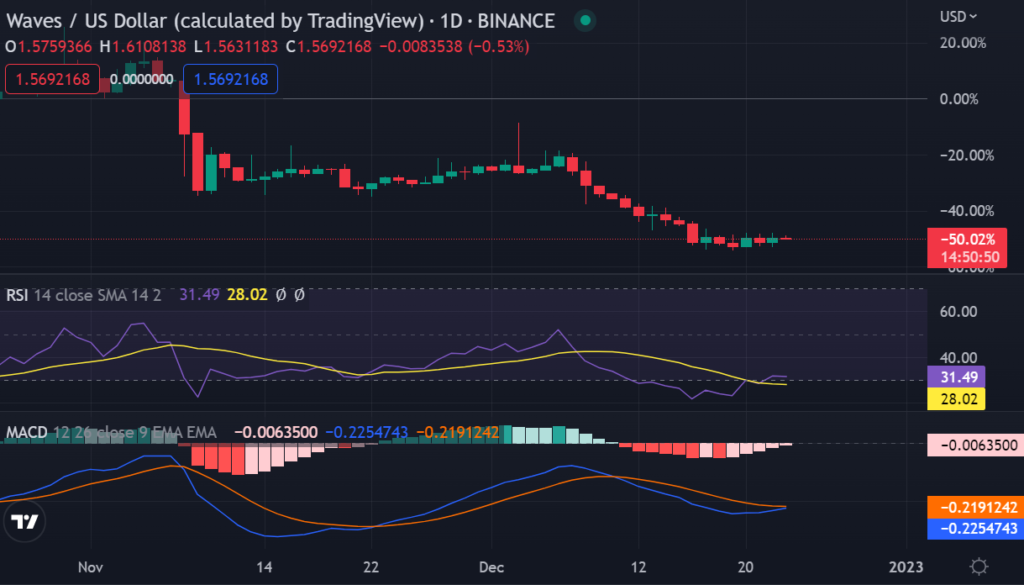
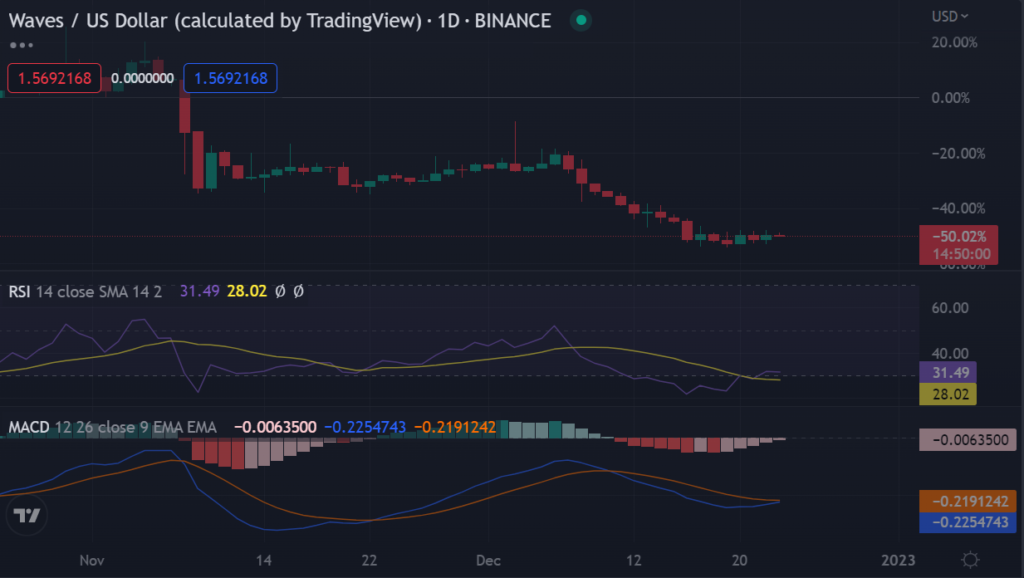
The daily chart price analysis reveals WAVES opened the daily trading session at an intraday low of $1.70 and has since moved sideways forming a descending triangle pattern. The price is trading within the SMA 200 and 100 curves, indicating that the trend direction is bearish in the long-term outlook. Moreover, the MACD histogram shows an increase in selling pressure and is currently residing below the zero line.
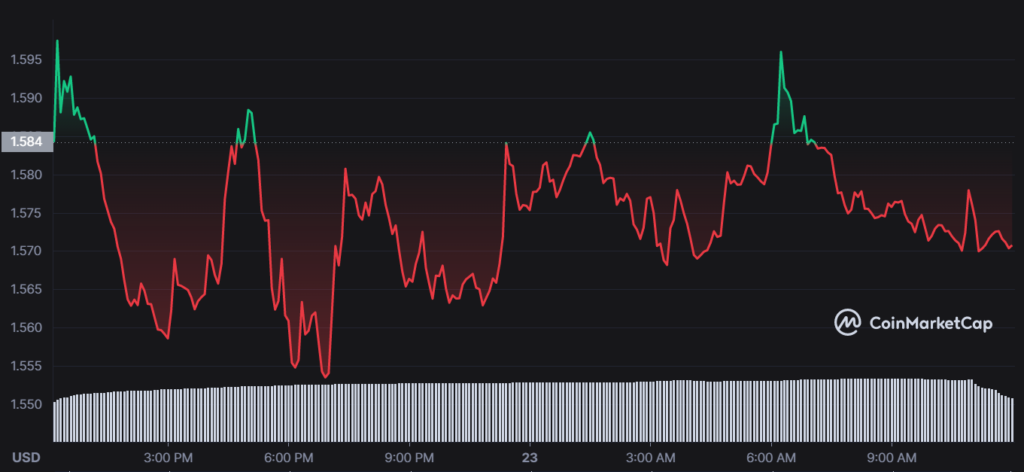
At the moment of writing, Waves is trading at $1.57, down by 1.73% in the last 27 hours. Waves cryptocurrency has formed a bearish descending triangle pattern which is normally seen as a signal of a bearish trend. The support for the coin is found at $1.0 while the resistance can be found at the $2.00 level.
On the upside, if WAVE manages to break above the strong $2.0 resistance, it could send the price toward higher levels in the near term. On the other side, a breakdown below the $1.0 support could see further losses for the coin and possibly even extend to its previous lows of around $0.50. Moreover, the Fibonacci Retracement levels indicate the next support level is around the $0.84 mark.
Waves price analysis on a 4-hour chart shows the bears have fully taken over the market. The 50-day SMA has crossed below the 200-day SMA, indicating a strong bearish trend. The MACD is showing increasing selling pressure and is trading in negative territory. Moreover, the RSI is currently near the oversold level of 30 and could see further downside unless buyers come into play soon.
Looking at the market volatility, the prices have made minor price fluctuations, indicating the overall trend is bearish. The Bollinger bands are also converging, which is a sign of low volatility.
Overall, the price analysis for Waves indicates that the bears have taken over the market and are in control. The support levels of $1.0 and $0.84 may come into play if buyers make an appearance soon but for now, it looks like further losses may be in store for the coin.
Disclaimer: The views and opinions, as well as all the information shared in this price prediction, are published in good faith. Readers must do their research and due diligence. Any action taken by the reader is strictly at their own risk. Coin Edition and its affiliates will not be held liable for any direct or indirect damage or loss.
Disclaimer: The information presented in this article is for informational and educational purposes only. The article does not constitute financial advice or advice of any kind. Coin Edition is not responsible for any losses incurred as a result of the utilization of content, products, or services mentioned. Readers are advised to exercise caution before taking any action related to the company.


