


- Both APE and GALA decreased by double-digit figures in the last 30 days.
- The CMF indicated equal buying and selling pressure for APE but the token can reclaim $1.13.
- GALA showed signs of increasing upward momentum and may target $0.015.
In the last 30 days, ApeCoin (APE) has had to deal with a 21.81% decrease in value. Another altcoin, Gala (GALA), also faced a similar situation. According to CoinMarketCap, GALA’s 30-day performance was a 30.39% fall, meaning that a lot of its holders have been coping with unrealized losses.
However, both cryptocurrencies may soon experience respite, according to a recent update from on-chain analytic firm Santiment. According to Santiment, GALA and APE, both remain underbought. This means that the cryptocurrencies could be trading below their actual potential worth.
Due to the condition mentioned above, Santiment noted the negative returns could soon undergo a correction, and this could lead to upsides for APE and GALA.
ApeCoin (APE)
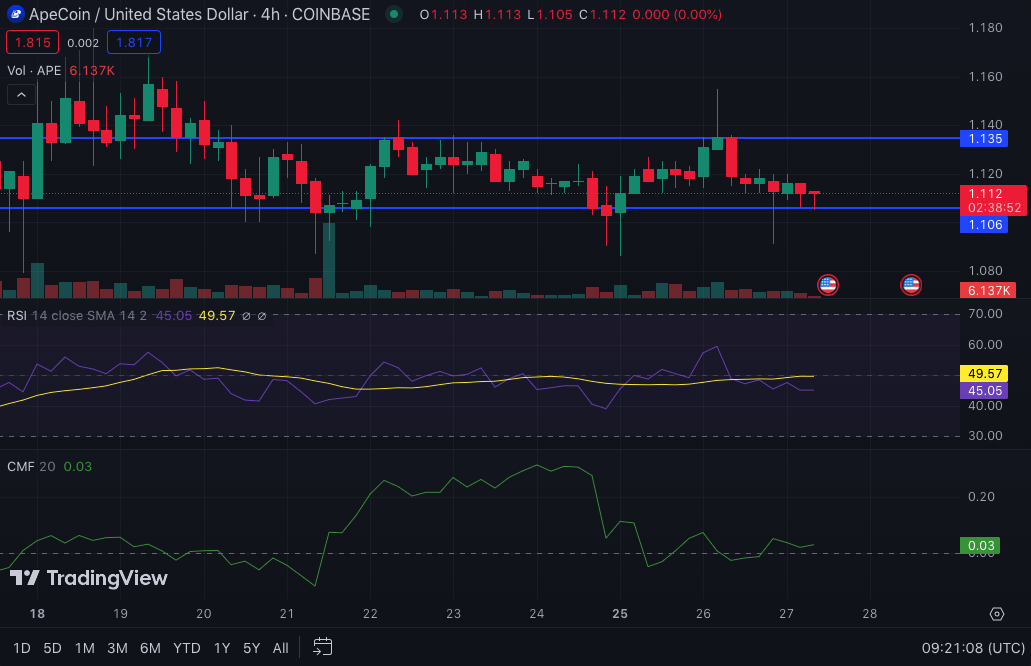
The APE/USD 4-hour chart showed that the cryptocurrency had no outlined direction. On September 26, bulls pushed APE to $1.13. However, the increase did not last as some profit-taking led to a depression, sinking APE to $1.11.
At the time of writing, the Relative Strength Index (RSI) was down to 44.43. This means that APE did not have so much strength behind it. Should the RSI cross the 50.00 midpoint, then APE could reclaim $1.13. If the RSI climbs more than that, then the token could rise as high as $1.17.
However, the potential hike could also depend on the Chaikin Money Flow (CMF). At the time of writing, the CMF was 0.03. Since this value was close to zero, it means that APE had almost equal buying and selling pressure. So, the CMF needs to exert buying pressure to substantially outweigh the sellers’ demand for APE’s price to increase.
Gala (GALA)
On the daily chart, GALA had formed a clear bearish structure with almost no sign of recovery. While the volatility decreased, GALA could be said to be oversold. This was because the lower band of the Bollinger Bands (BB) was on the verge of touching the price at $0.013.
Meanwhile, the Moving Average Convergence Divergence (MACD) revealed that GALA may soon recover. At the time of writing, the MACD was 0.0001. The positive MACD value is a sign of increasing upward momentum. So traders may want to refrain from opening short GALA contracts.

The potential was also reinforced by the blue and orange dynamic lines. Although both lines were in the negative region, the blue had crossed over the red. This is a sign that buyers are getting back into the market. If the buying pressure continues, GALA has the potential to reach $0.015.
Disclaimer: The views, opinions, and information shared in this price prediction are published in good faith. Readers must do their research and due diligence. Any action taken by the reader is strictly at their own risk. Coin Edition and its affiliates will not be liable for direct or indirect damage or loss.
Disclaimer: The information presented in this article is for informational and educational purposes only. The article does not constitute financial advice or advice of any kind. Coin Edition is not responsible for any losses incurred as a result of the utilization of content, products, or services mentioned. Readers are advised to exercise caution before taking any action related to the company.


