


 Uptrend Depends on the $7.85 Support")
- APT may form a support at $7.85, a trader pointed out on X.
- There has been a bullish crossover that could take APT beyond the $7.18 resistance.
- Should buying pressure continue, APT may reverse from its slight drawdown.
A month ago, the value of Aptos (APT) flipped the $7.20 psychological area. However, the notable gains the token provided resulted in massive profit-taking from holders of the cryptocurrency. As a result, the APT price plunged and was trading at $7.03.
Before the jump back above $7, APT fell as low as $6.48. But it was around the same point that support formed, triggering an uptick to $7.12 on November 4. While the price has now declined, crypto investor and trader Crypto Tony opined that there was no reason to fret.
According to Tony, it could be a wise decision to open a long position for APT. However, in his post on X (formerly Twitter), he noted that there are conditions to the projected price rise.
After the Plunge, Comes the Reversal
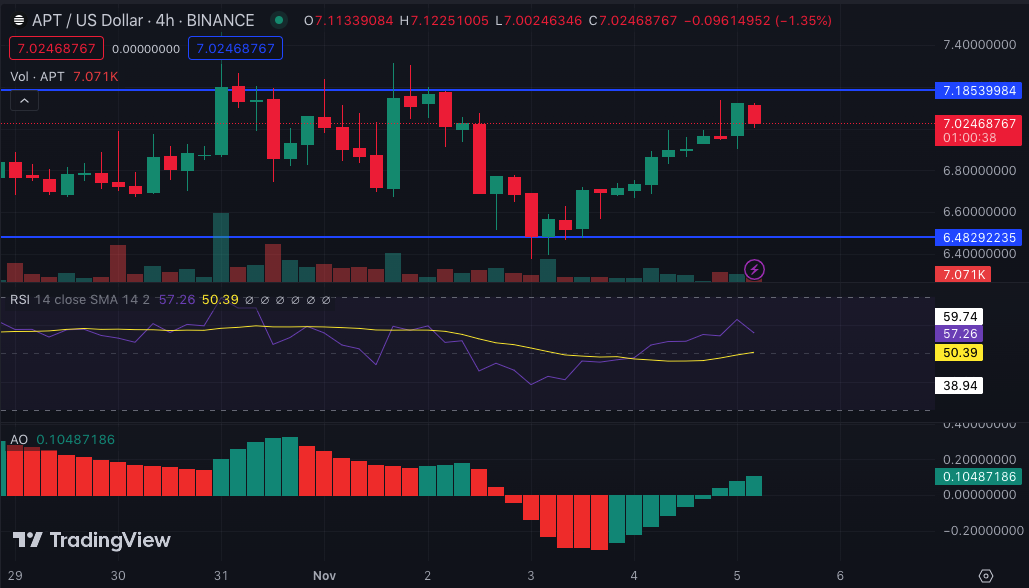
From the post above, Tony mentioned that APT needed to flip a resistance (possibly the $7.18 region as shown below) before it could jump to $7.85. Thereafter, the cryptocurrency price could continue another leg up the charts.
The APT/USD 4-hour chart showed that the current strength displayed by the token was relatively okay. This inference was obtained from the Relative Strength Index (RSI). At the time of writing, the RSI was 571.5.
This reading denotes good buying pressure. But it might not be enough to drive APT above $7.18. For APT to have a chance at a $7.85 support, the RSI reading has to at least cross 65.00.
Other indicators like the Awesome Oscillator (AO) showed that the price target was possible. As of this writing, the AO was 0.10, thanks to a bullish crossover. Whenever this switch of the AO from below zero occurs, it is a sign that a reversal against the previous market trend is on the way.
MACD and CMF Support the Bulls
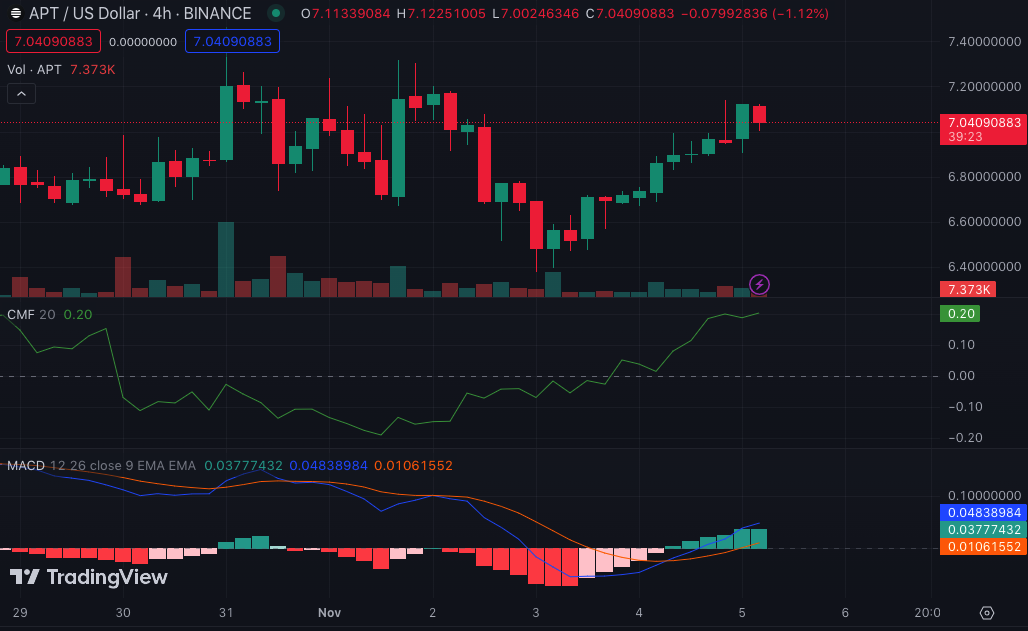
Thus, it is possible for APT to flip the $7.20 again. At the same time, the token’s buying momentum needs to be at a really solid pace. Another indicator aligned with the bullish thesis is the Chaikin Money Flow (CMF).
The CMF measures buying and selling pressure. With the indicator largely in the negative territory, it is assumed that there is a strong buying momentum backing the APT price action. Hence, a significant plunge may not be on the table.
This assertion was also reinforced by the Moving Average Convergence Divergence (MACD). Like the AO, the MACD also had a bullish crossover.
In conclusion, APT’s price action has a solid chance of being in the upward direction over the next few days. Similarly, the potential rise to $7.85 would need much more activity from bulls.
Disclaimer: The information presented in this article is for informational and educational purposes only. The article does not constitute financial advice or advice of any kind. Coin Edition is not responsible for any losses incurred as a result of the utilization of content, products, or services mentioned. Readers are advised to exercise caution before taking any action related to the company.


