- OM’s price dropped to $0.15 after participants began to book profits.
- A retest of $0.19 looked possible, but traders should watch out for key support points.
- Buying momentum had become weak, suggesting that the bullish thesis could be invalidated.
The price of MANTRA (OM) has pulled back despite gaining as much as 136% in the last 30 days, CoinMarketCap revealed. As of this writing, MANTRA’s price was $0.15. But before the recent decrease, the token jumped as high as $0.19.
The fall to $0.15 represents an 8.18% decrease in the last 24 hours. It is noteworthy to mention that OM’s price action was different from that of most altcoins. As 2024 began, a lot of altcoins, including Solana (SOL) and Avalanche (AVAX) erased a chunk of the gains they had in 2023.
Buying Has Slowed Down
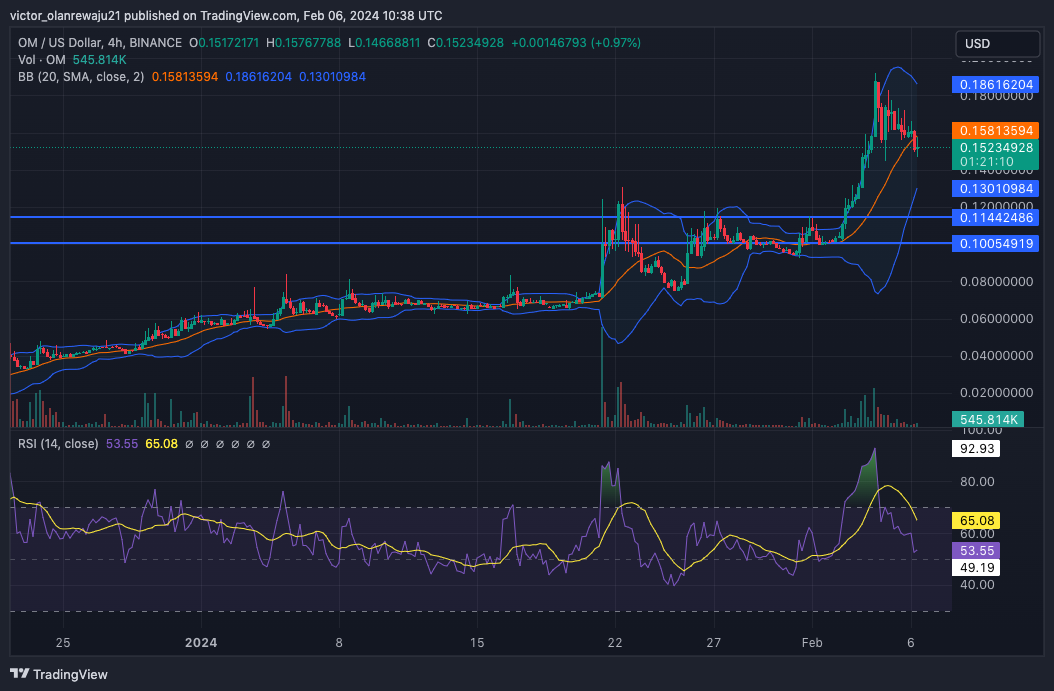
OM’s initial attempt at a rally was resisted on January 22. This rejection caused the token to fall to $0.07. The Bulls attempted the move again on January 25, but again, the move was rejected.
However, OM bounced off the $0.10 support on February 1 and reached a peak of $0.19 three days later. So far, profit-taking has triggered a decline in OM’s price, and as it stands, another decline might be imminent.
At press time, the Bollinger Bands (BB) showed that volatility around the token remained high. This suggests that there could be extreme price fluctuations for OM in the short term. If bulls push above the daily high, OM might retest $0.19.
However, the price might also continue sinking. If this is the case, key support levels to watch would be between $0.11 and $0.14. Furthermore, information from the 4-hour chart showed that the Relative Strength Index (RSI) had dropped to 53.55.

OM/USD 4-Hour Chart (Source: TradingView)
The Next Dump May Be Mild
This reading was proof that buyers were no longer as active as they were a few days ago. Should buying momentum refuse to reach previous heights, then OM’s next move could be a decrease to $0.13.
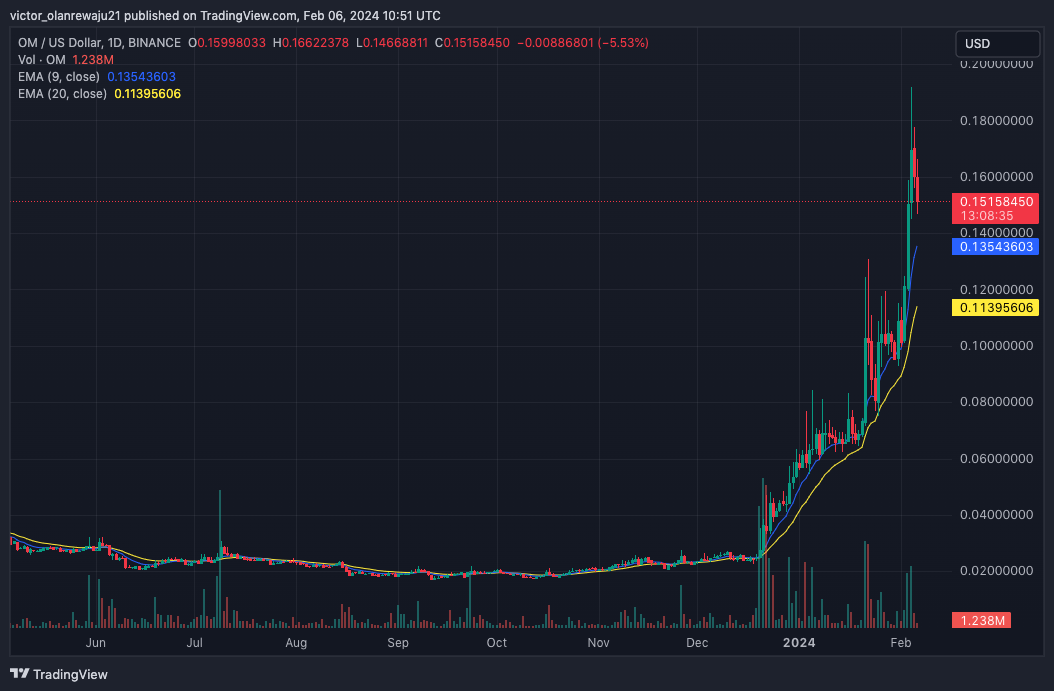
Despite the bearish potential, indications from the daily chart showed that OM might still hit a region around $0.21 before it dumps. This was mainly because of the Exponential Moving Average (EMA) position.
At press time, the 9 EMA (blue) was at $0.13, while the 20 EMA (blue) was $0.11. The crossover of the 9 EMA against the 20 EMA suggests a potential bullish trend for OM.

OM/USD Daily Chart (Source: TradingView)
Also, OM’s price remained above both EMAs, indicating that selling pressure was not too intense to send the price as low as $0.11.
Disclaimer: The information presented in this article is for informational and educational purposes only. The article does not constitute financial advice or advice of any kind. Coin Edition is not responsible for any losses incurred as a result of the utilization of content, products, or services mentioned. Readers are advised to exercise caution before taking any action related to the company.


