


- DOT eyed a rise to $7, wile TON’s drop below $2 could be imminent.
- ADA might drop to $0.455 while AVAX could target a jump to $33.35.
- XRP’s momentum was weak, suggesting a move below $0.50 in the coming days.
The last few days have been torrid for the crypto market as many altcoin prices failed to recover. Coin Edition evaluated the performances of some cryptocurrencies including Ripple (XRP), Cardano (ADA), Avalanche (AVAX), Polkadot (DOT), and Toncoin (TON).
While there were attempts to push prices up, most were not successful. For those who jumped slightly, the movements were short-lived.
At press time, XRP’s price was $0.51—a 6.98% seven-day decrease. ADA changed hands at $0.46, indicating that the token’s value had fallen by 6.11%. A look at CoinMarketCap showed that AVAX was not any better as the price decreased to $30.64.
DOT’s value dropped by 9.35% while TON slid by 5.16% within the same period. But with a new week coming up, market participants are hopeful that some respite would come into the market and stabilize prices.
Ripple (XRP)
From the H4 XRP/USD chart, bears remained dominant as the token kept losing hold on different support levels. For instance, bulls tried to defend the $0.55 support on January 18.
But selling pressure ensured that the attempt was void. A similar thing happened on January 23 as XRP could not resist bearish forces from breaching the $0.52 support.
Furthermore, the RSI at press time was 37.51, suggesting a weak momentum for XRP. If this reading continues to hover around the same area, the price of XRP could drop below $0.50 by next week.
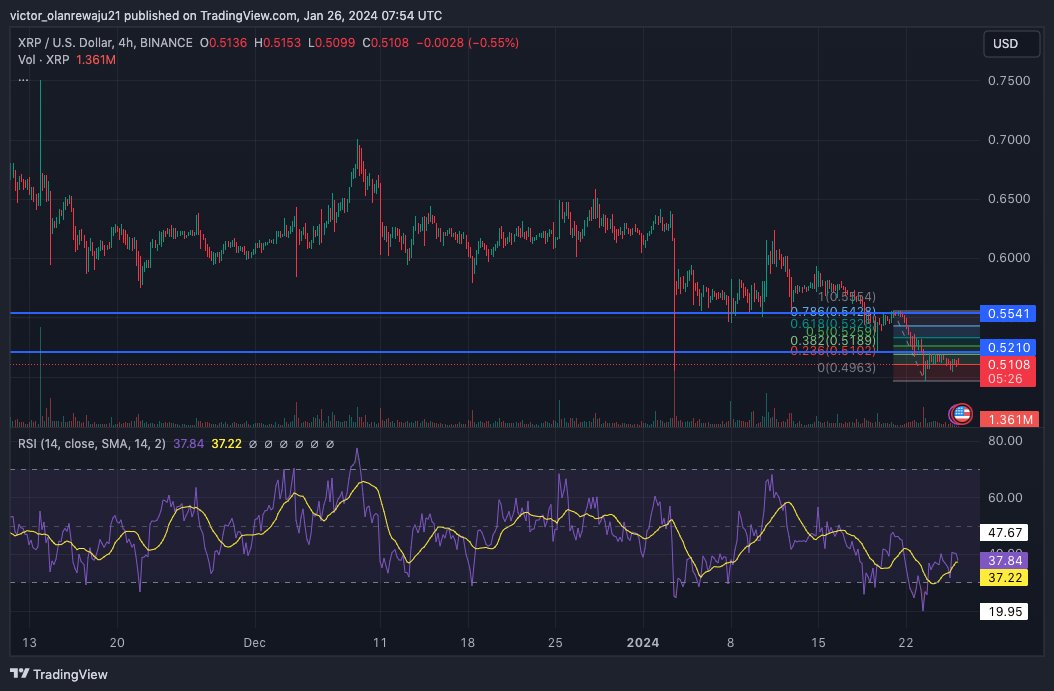
XRP/USD 4-Hour Chart (Source: TradingView)
Meanwhile, the 0.236 Fibonacci level was around $0.50, suggesting that buyers could make good entries before the token price recovers.
Cardano (ADA)
To assess ADA’s potential in the coming week, Coin Edition looked at the exponential moving average (EMA).
At press time, the 9 EMA (blue) was at $0.470 while the 20 EMA (yellow) was at $0.478. These prices were higher than ADA’s price at the time of writing, which was $0.468. Also, since the 20 EMA was above the 9 EMA, it suggests the short-term trend was bearish.
If ADA fails to break above $0.47 soon, the price could go as low as $0.455. However, a break above the 9 EMA could create a window to rise to $0.49.
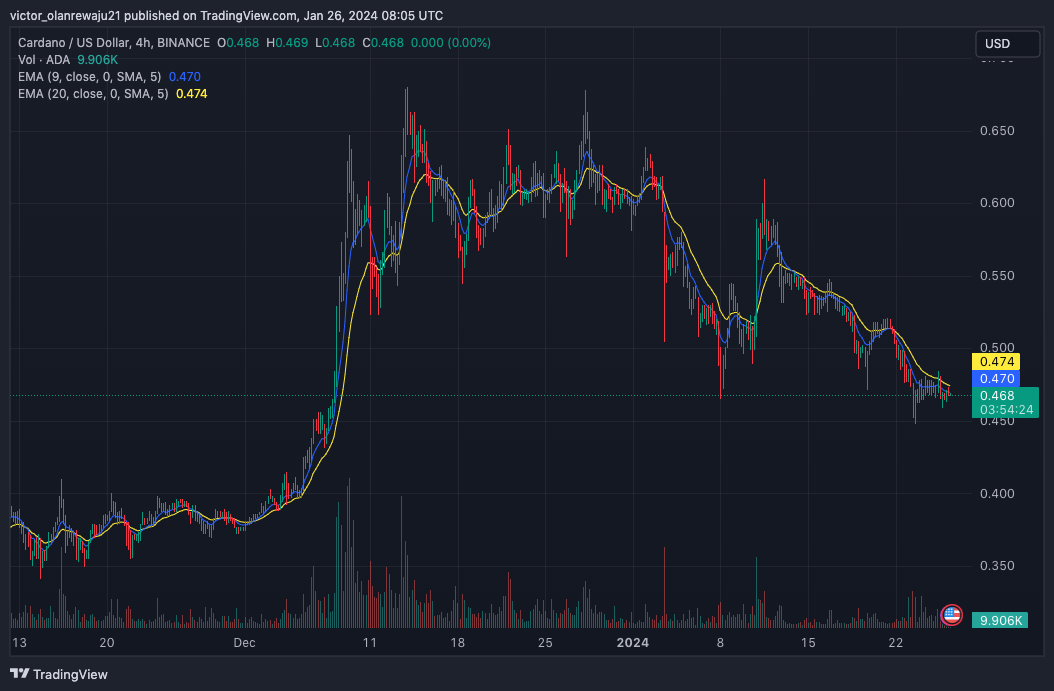
ADA/USD 4-Hour Chart (Source: TradingView)
Avalanche (AVAX)
On the 4-hour chart, AVAX had formed a descending channel, confirming how it was going through a bearish phase.
Despite the pattern, AVAX was showing signs of recovery which could reverse its trajectory. But the price would need to flip the support at $31.95 to confirm the bias. It would also need to breach the existing resistance around $33.35.
Should this be the case, AVAX could ride all the way ahead to $35. This sentiment was also supported by the MACD. At press time, the MACD was 0.16. Also, the 12-day EMA (blue) had crossed above the 26-day EMA (orange).
This suggests that buyers were starting to outpace sellers. If this remains so, AVAX’s price might increase next week. But if sellers take back control, the price could drop below $30.
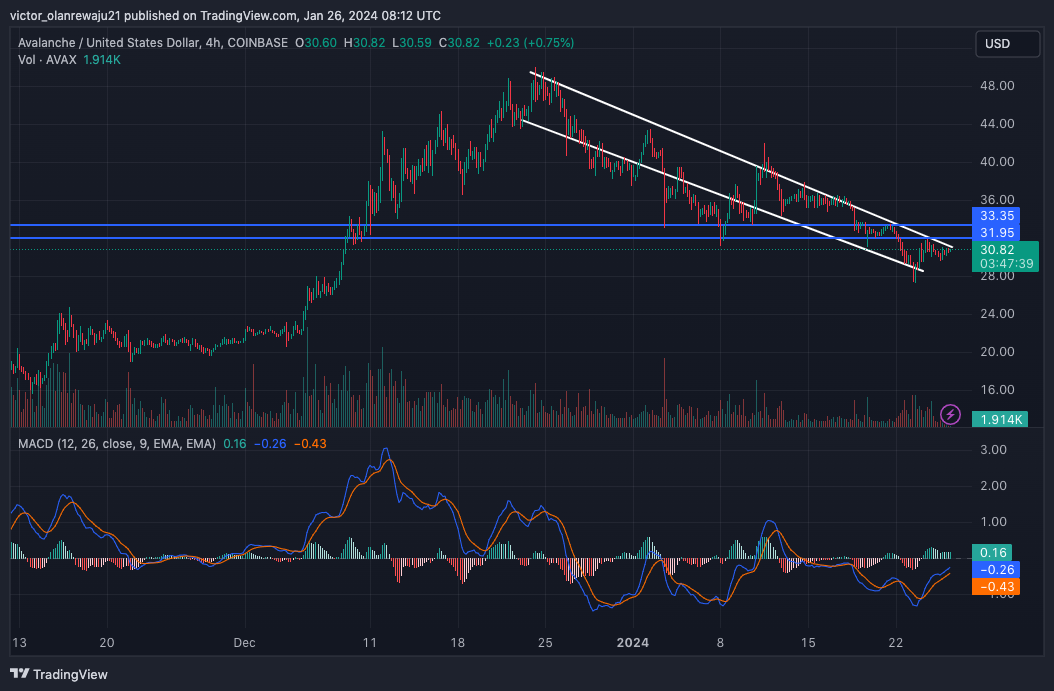
AVAX/USD 4-Hour Chart (Source: TradingView)
Polkadot (DOT)
DOT’s market structure showed signals that it was about to exit its bearish phase. At press time, the price was $6.40. However, its potential uptrend could depend on the support at $6.36. If the token maintains the support, the price might rise higher.
But if it does not, the price could drop as low as $5.35 which was a notable point of interest. A look at the Awesome Oscillator (AO) showed it was still negative.
However, the green bars arising on the indicator suggest a possible flip to the bullish momentum. The RSI had also risen to 44.19, suggesting that buyers were slowly returning to the market.
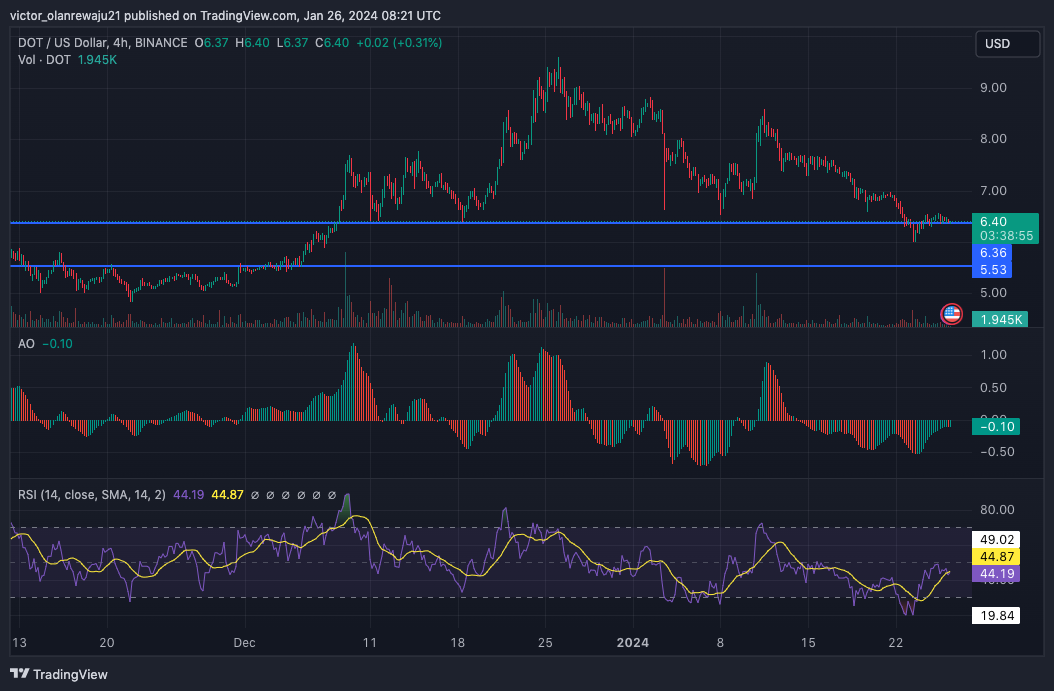
DOT/USD 4-Hour Chart (Source: TradingView)
If the AO turns positive and the RSI rises above 50.00, DOT might rise beyond $7.00. However, if it does not, the price could keep consolidating around $6.00 and $6.62.
Toncoin (TON)
TON’s price at press time was $2.06. But a look at the EMAs showed that it had a similar state to XRP. As per the 4-hour chart, the 20 EMA (yellow) had crossed above the 9 EMA (blue), indicating a bearish bias.
If this position continues to remain the same, then TON might drop below $2 as early as next week.
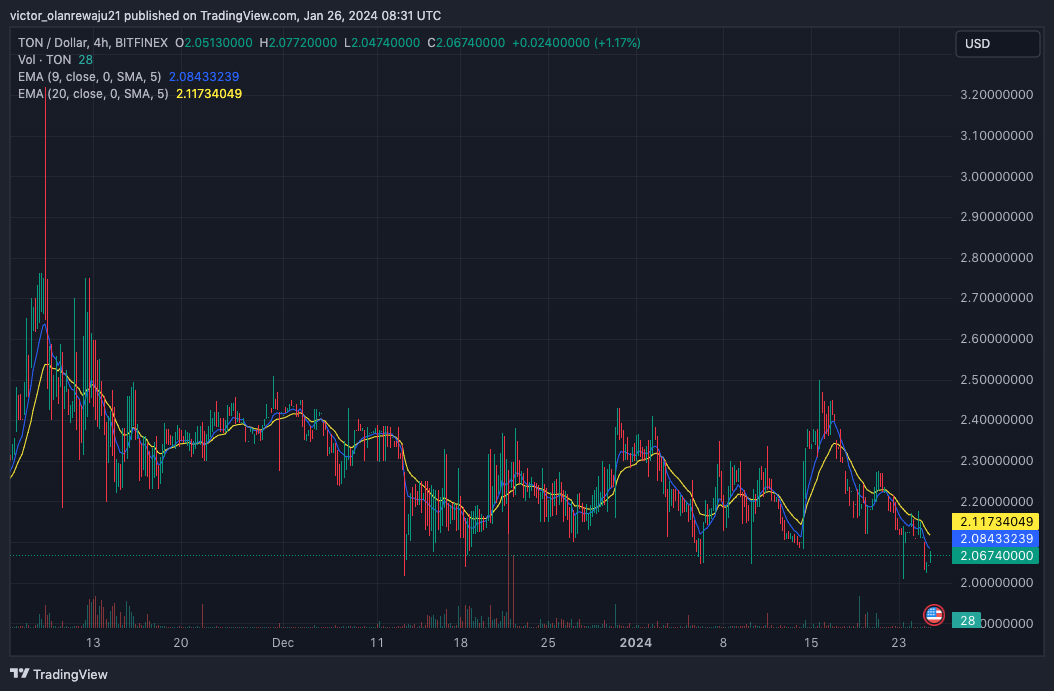
TON/USD 4-Hour Chart (Source: TradingView)
However, an influx of buyers could push the price higher. But in the meantime, that looks unlikely.
Disclaimer: The information presented in this article is for informational and educational purposes only. The article does not constitute financial advice or advice of any kind. Coin Edition is not responsible for any losses incurred as a result of the utilization of content, products, or services mentioned. Readers are advised to exercise caution before taking any action related to the company.


