


- XDC price hits 52-week high after SBI VC Trading collaboration.
- A bullish trend emerges in the XDC market, driving prices up by over 19%.
- The overbought XDC market suggests a potential short-term pullback.
Early in the day, bears dominated the XDC Network (XDC) market; however, support was eventually achieved at the $0.04639 low. As a result, buyers were able to counteract the selling pressure, sending the XDC price soaring to a 52-week high of $0.06024 before a modest retreat.
This price spike was fueled by positive news about the project’s relationship with the Japanese cryptocurrency trading platform SBI VC Trading to sponsor WebX 2023. WebX 2023 is a widely anticipated event in the cryptocurrency sector that will draw worldwide attention and boost investor trust in XDC.
The collaboration with SBI VC Trade provides financial assistance and opens up new opportunities for XDC adoption and market expansion.
Bulls were in charge of the XDC market at the time of publication, resulting in a 19.27% increase in price to $0.05991. As the market capitalization of the XDC increased by 19.36% to $830,421,090, the 24-hour trading volume climbed by 42.33% to $19,139,693. This increase in price and market capitalization reflects increased demand and confidence in XDC.

The 10-day Simple Moving Average (SMA) moves above the 50-day SMA on the XDCUSD price chart, with the former touching 0.053739 and the latter (yellow) touching 0.046274, respectively. This movement indicates the emergence of a bullish trend in the XDCUSD market.
When the shorter SMA rises above, the longer SMA, it can be interpreted as a possible shift in momentum toward higher prices. Traders may interpret this as a signal to consider purchasing XDCUSD, anticipating further price increases.
With the Aroon up (orange) reading of 100% and the Aroon down reading of 50% pointing southward, the XDCUSD market is experiencing strong upward momentum. This trajectory indicates a high likelihood of further price appreciation soon. Traders looking to profit from this bullish trend should consider entering long positions or increasing their existing positions in XDCUSD.

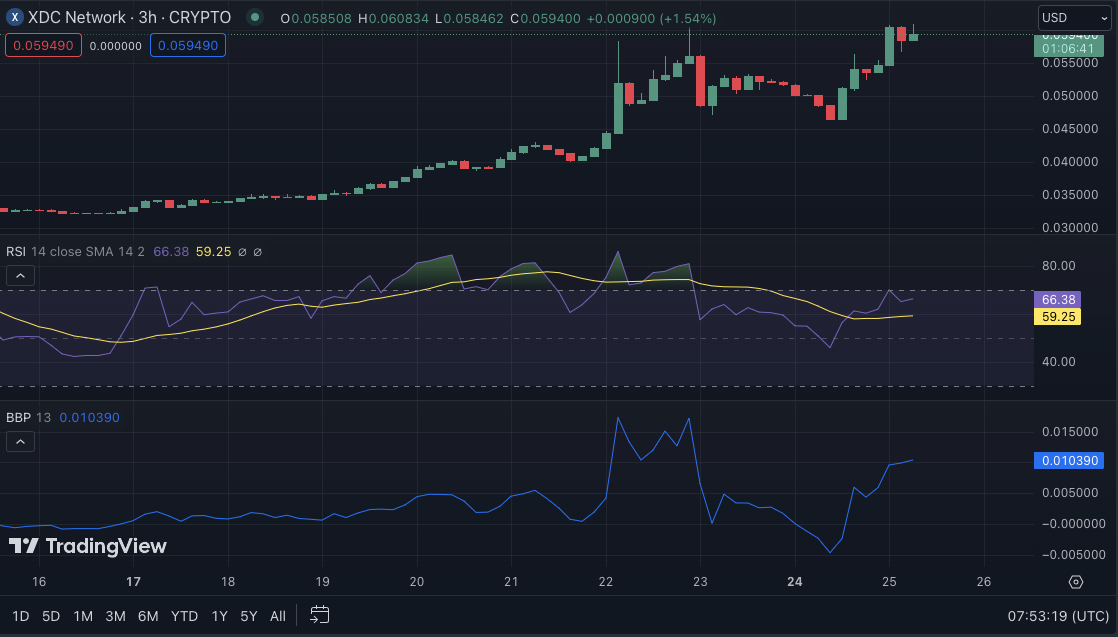
The XDCUSD market is currently slightly overbought, according to the Relative Strength Index rating of 66.91. While this level suggests the possibility of a short-term pullback, the strong upward momentum and high Aroon readings suggest that any dips are likely to be temporary and will be followed by further price gains
A Bull Bear Power (BBP) rating of 0.010281 indicates that bulls dominate the XDCUSD market. This positive BBP rating suggests that there is still room for price appreciation in the near term. As such, when the market continues to show signs of strength, investors may consider holding their positions or even adding to them.
In summary, XDC’s partnership with SBI VC Trading for WebX 2023 has ignited a bullish trend, propelling the price to a 52-week high. With strong momentum and positive indicators, investors may anticipate further gains ahead.
Disclaimer: The views, opinions, and information shared in this price prediction are published in good faith. Readers must do their research and due diligence. Any action taken by the reader is strictly at their own risk. Coin Edition and its affiliates will not be liable for direct or indirect damage or loss.
Disclaimer: The information presented in this article is for informational and educational purposes only. The article does not constitute financial advice or advice of any kind. Coin Edition is not responsible for any losses incurred as a result of the utilization of content, products, or services mentioned. Readers are advised to exercise caution before taking any action related to the company.


