


- After the widespread fall in the market, XRP became the biggest loser out of the top 10.
- Short-term traders can look for an entry between $0.45 to $0.49 if selling pressure continues.
- The downward trajectory could lose momentum soon since the KST descended and was negative.
Like the rest of the market, Ripple (XRP) witnessed a sharp decline, with the token’s value plummeting by 7.19% in the last 24 hours. The decline happened on account of Bitcoin’s (BTC) plunge to $26,000.
According to CoinMarketCap, XRP’s price at press time was $0.50. This means that the token’s 7-day performance was the worst out of the top 10 in market capitalization. For the XRP Army, the last few weeks have not been exactly favorable.
To add insult to its injury, the SEC got approval to file an appeal motion against XRP’s partial win in July. However, traders and investors are also pondering whether this downturn presents a lucrative “buy the dip” opportunity or signals more extended bearish trends ahead.
Based on the daily chart, XRP was deeply oversold as indicated by the Relative Strength Index (RSI). At press time, the RSI was 22.53. However, the bearish momentum could offer a buying opportunity for short-term traders when looking at XRP’s historical performance.
For instance, when the RSI closely approached 30 on July 6, XRP reversed from its price at $0.46. A few days later, the token value skyrocketed while not denying the impact of the SEC judgment at that time.
But if selling pressure continues, XRP could fall a little further, and the next target could be between $0.45 and $0.49. Also, these prices could be perfect entries for traders who are looking to gain when the market stabilizes.
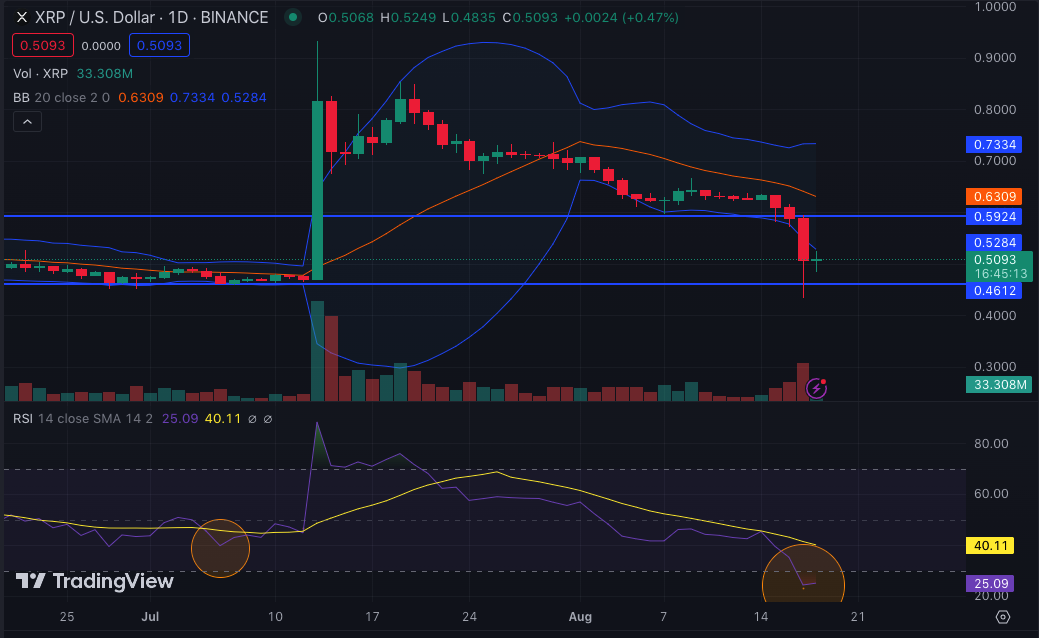
At the same time, traders might need to watch out for increasing volatility, as shown by the Bollinger Bands (BB). From the chart above, the BB also reinforced the notion that XRP was oversold since the lower band touched the price at $0.50. Therefore, a strong reversal could be on the cards in a few days.
Furthermore, the Know Sure Thing Indicator (KST) crossed into the negative region. The negative reading indicates that the current market momentum is favoring the bears.
Also, since the KST was descending, it means that soon enough, the downside momentum may lose control. Consequently, XRP has the potential to face the upward direction once a slight buying pressure appears.
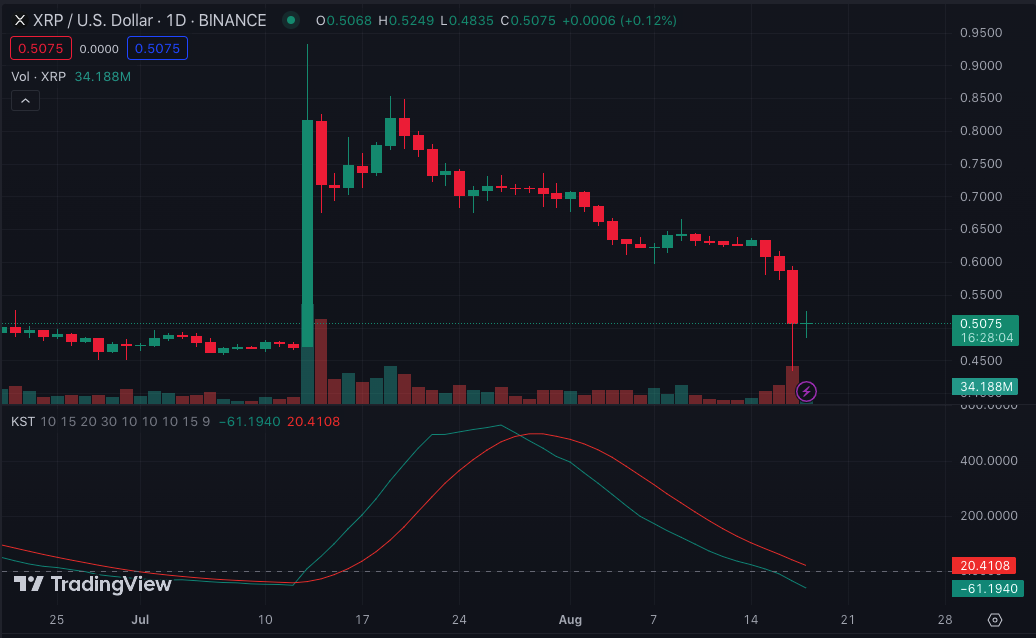
If demand resurges, then XRP could jump as high as $0.55. But rising above $0.60 would require some influence from macro external factors.
Disclaimer: The views, opinions, and information shared in this price prediction are published in good faith. Readers must do their research and due diligence. Any action taken by the reader is strictly at their own risk. Coin Edition and its affiliates will not be liable for direct or indirect damage or loss
Disclaimer: The information presented in this article is for informational and educational purposes only. The article does not constitute financial advice or advice of any kind. Coin Edition is not responsible for any losses incurred as a result of the utilization of content, products, or services mentioned. Readers are advised to exercise caution before taking any action related to the company.


