


- Throughout the past day, XRP saw its price rise by more than 3% to trade at $0.4834 at press time.
- From a technical perspective, XRP’s price had printed 3 higher lows over the past month.
- Technical suggested a multi-week rally could be in the cards for XRP this July.
Ripple (XRP) earned itself a spot on CoinMarketCap’s trending list after it saw a more than 3% increase in its price over the past 24 hours of trading. This left the remittance token trading at $0.4834 at press time. Furthermore, technical indicators on the altcoin’s daily chart suggested that July could be a good month for the altcoin’s price.
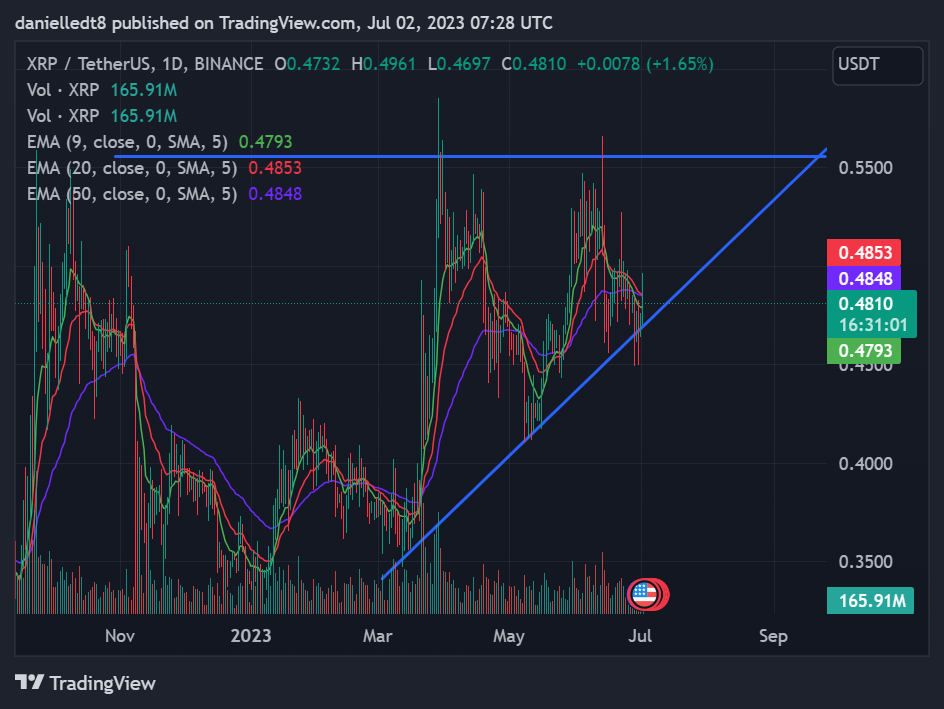
From a technical perspective, XRP’s price had printed 3 higher lows over the past month. As a result, a bullish ascending triangle chart pattern formed on XRP’s daily chart. The latest low was printed on Friday and the remittance token’s price has been in a mini upward trend since then.
Over the past 24 hours, XRP was able to break above the 50-day and 20-day EMA lines, but retraced to trade back below the two technical indicators at press time. The altcoin’s price closing today’s trading session above the two EMA’s will be a bullish sign for XRP, and may result in a multi-week rally.
Should XRP successfully close today’s trading session above the 20-day and 50-day EMA lines, it will have the momentum needed to challenge the base of the bullish triangle chart pattern that formed on its daily chart at $0.5554 in the coming 2 weeks. A break above this level will clear a path for XRP to soar to $0.6862.
XRP’s journey to the base of the aforementioned chart pattern will not be a smooth ascent, as traders and investors may look to take profit. Should XRP’s price drop in the coming weeks, it will most likely result in a new higher low being established.
This bullish thesis will be invalidated if the 20-day EMA line crosses below the 50-day EMA line in the next few days, or if XRP’s price closes the next 2 trading sessions below the 50-day EMA line. In either of these scenarios, XRP’s price may be at risk of dropping to $0.4491. Continued sell pressure at this level may even push XRP’s price down to $0.4154.
Disclaimer: The views and opinions, as well as all the information shared in this price analysis, are published in good faith. Readers must do their own research and due diligence. Any action taken by the reader is strictly at their own risk. Coin Edition and its affiliates will not be held liable for any direct or indirect damage or loss.
Disclaimer: The information presented in this article is for informational and educational purposes only. The article does not constitute financial advice or advice of any kind. Coin Edition is not responsible for any losses incurred as a result of the utilization of content, products, or services mentioned. Readers are advised to exercise caution before taking any action related to the company.


