


- More than 830 million XRP changed hands at $1.06, making it a major support.
- A break below $1.06 could expose lower support levels at $0.80, $0.62, and $0.51.
- A separate chart places XRP’s broader bottoming range between $0.85 and $1.03.
XRP has reached a pivotal support test at $1.06, where historical transaction activity shows a dense concentration of previous buying. According to market analyst Ali Charts, more than 830 million tokens changed hands at that price, based on Glassnode’s UTXO Realized Price Distribution data.
The metric tracks where supply previously moved, helping identify price zones with notable holder exposure. At $1.06, that exposure places the market near its first major defensive level.
XRP’s $1.06 Support Test Reveals Three Lower Price Floors
According to Ali, a sustained move below $1.06 would shift attention toward three lower transaction clusters. The first sits at $0.80, where approximately 923 million XRP previously changed hands.
Below that level, the chart identifies $0.62 as the largest nearby accumulation zone. About 1.16 billion XRP moved at that price.
The final major level appears at $0.51, where roughly 1.06 billion XRP was transacted. Together, the four zones create a descending map of historical activity from $1.06 to $0.51.
These levels, however, do not confirm future buying demand. Instead, they show where substantial volumes were previously exchanged and where holder positioning remains concentrated.
XRP’s Bottoming Range Extends From $0.85 to $1.03
Meanwhile, a separate chart from market analyst EGRAG Crypto places XRP within a broader support region extending from about $0.85 to $1.03. The analyst described the structure as a “bottoming phase” near the lower boundary of a falling wedge pattern.
The chart also shows former horizontal support between approximately $1.67 and $1.82. Following the earlier breakdown, that band now represents an important recovery threshold.
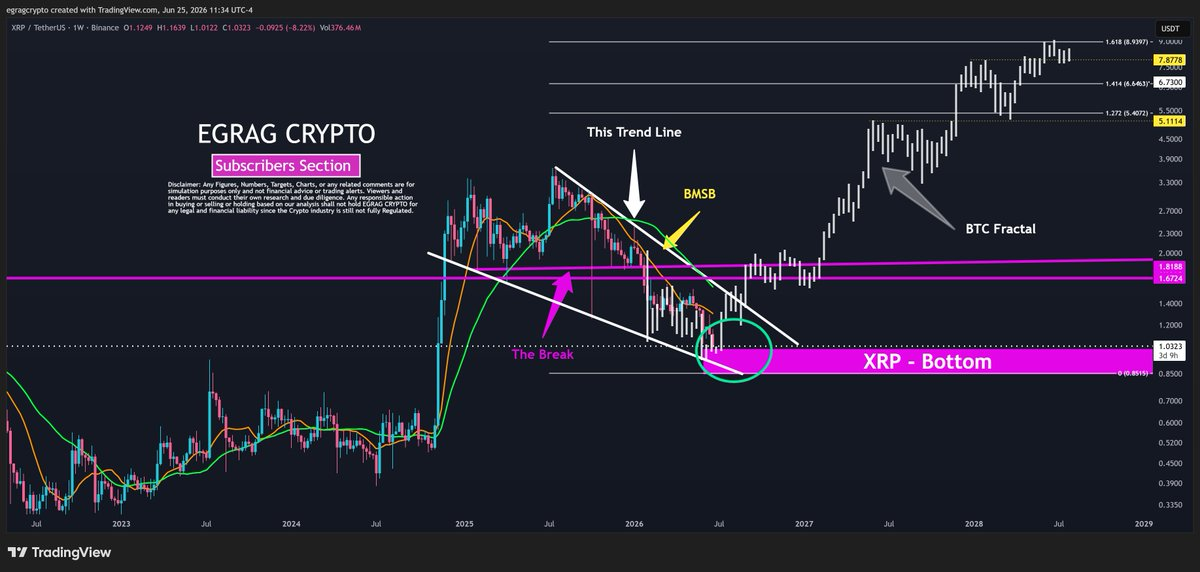
EGRAG’s chart includes a Bitcoin-style fractal and Fibonacci levels at $5.11, $6.73, $7.88, and $9. Those figures form part of the analyst’s illustrated scenario, rather than confirmed market targets.
For the immediate outlook, both analyses converge near the same area. Ali’s $1.06 volume block sits directly above EGRAG’s $0.85-to-$1.03 support range.
That overlap makes the current zone central to both technical readings. The charts place the lower support levels in focus only after a confirmed loss of this area.
Related: XRP Shows Mixed Market Signals Despite Falling Exchange Reserves
Disclaimer: The information presented in this article is for informational and educational purposes only. The article does not constitute financial advice or advice of any kind. Coin Edition is not responsible for any losses incurred as a result of the utilization of content, products, or services mentioned. Readers are advised to exercise caution before taking any action related to the company.
: What Happens If You Use an Unlicensed Platform?")


