
- XRP trades at $1.1132, down 1.35% testing the bottom of a range it has been trapped in since early June
- XRP spot ETFs recorded $5.31M in inflows on June 22, pushing cumulative net inflows to $1.45B and total net assets to $993.29M
- Net spot outflows hit -$7.10M on June 23, continuing a pattern of consistent red netflow days since late August 2025
XRP trades at $1.1132 on June 23, down 1.35% and once again testing the lower boundary of the range it has been compressed inside since early June, even as spot ETF data shows steady institutional accumulation building beneath the surface.
XRP Daily Chart: Compression Continues With No Clear Breakout
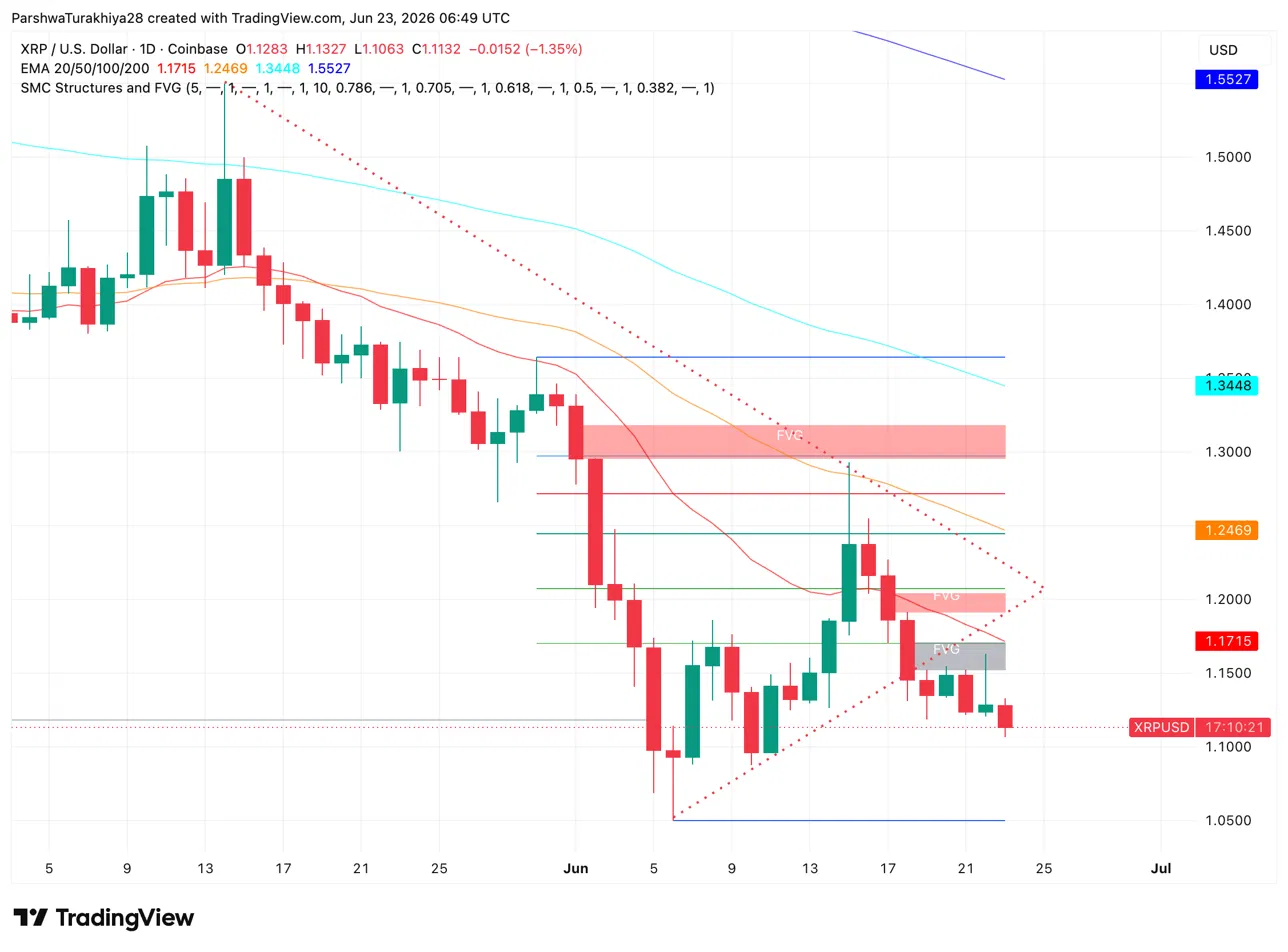
The daily chart shows XRP trapped between resistance near $1.30 and support around $1.10 for most of June, repeatedly rejected at the upper FVG zone between $1.30 and $1.36 while failing to hold gains above $1.20. All four EMAs sit overhead in bearish order: 20 at $1.1715, 50 at $1.2469, 100 at $1.3448, and 200 at $1.5527.
Related: Ethereum Price Prediction: Three Top Analysts Say ETH Could Hit $50,000
The pattern here is one of fading momentum rather than a clean trend. Each rebound attempt from support has produced a smaller bounce than the last, and the most recent decline pushed price back toward the $1.10 zone that has now been tested multiple times this month. A daily close below $1.0509 would break the ascending structure that has loosely supported price since the early June low.
- Resistance: $1.1715 (20 EMA), $1.2469 (50 EMA)
- Support: $1.10 (range floor), $1.0509 (June low)
XRP ETFs Pulled $5.31M as Cumulative Inflows Approach $1.45B
XRP spot ETFs recorded $5.31M in net inflows on June 22, all of it through Bitwise’s XRP product, which added $5.31M and now holds $305.40M in net assets. Cumulative net inflows across all XRP ETFs stand at $1.45B with total net assets at $993.29M, just shy of the $1B milestone.
The daily inflow history shows a consistent, if modest, pattern of accumulation through June. June 18 brought $2.55M, June 16 added $5.30M, and June 9 saw the month’s strongest single day at $7.44M. Outflow days have been rare and small by comparison, with June 3 marking the only meaningful negative session at -$5.34M.
Spot Netflows Tell a Different Story Than the ETF Data
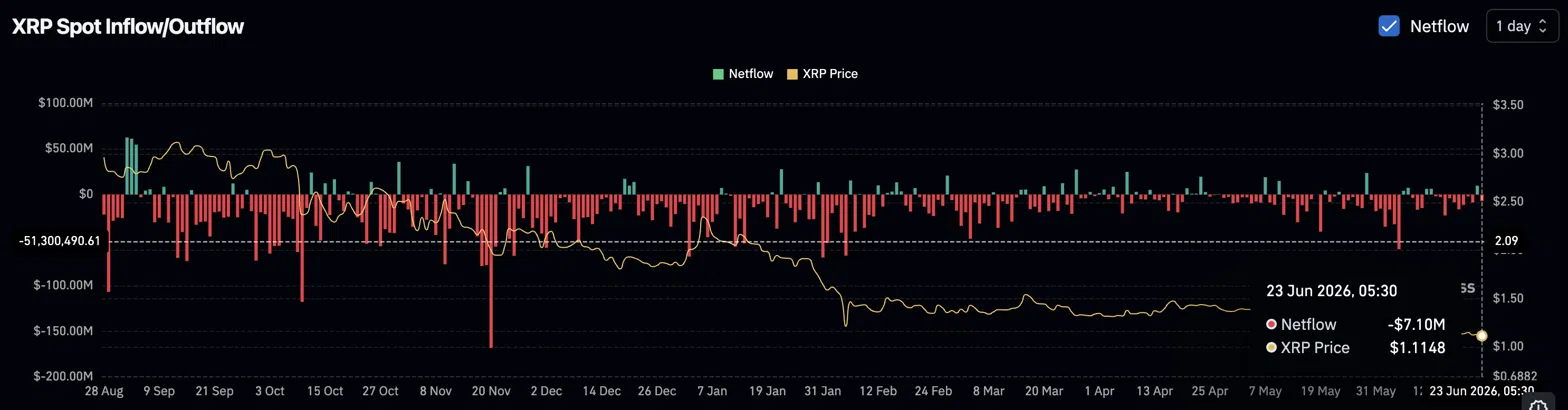
Net outflows have dominated almost every session since late August 2025, with red bars vastly outnumbering green ones across nearly ten months of data. June 23 recorded a net outflow of -$7.10M, continuing that pattern.
Related: DeXe Price Prediction: DEXE Surges 62% as Bulls Target a Breakout Toward $26
The divergence between steady ETF accumulation and persistent broader market outflows suggests institutional buyers through regulated products are absorbing supply that retail and exchange-based holders continue to sell. That tension is part of why XRP has struggled to build sustained momentum despite the ETF inflow streak.
XRP Derivatives: Volume Up 29% as Shorts Take the Bigger Hit
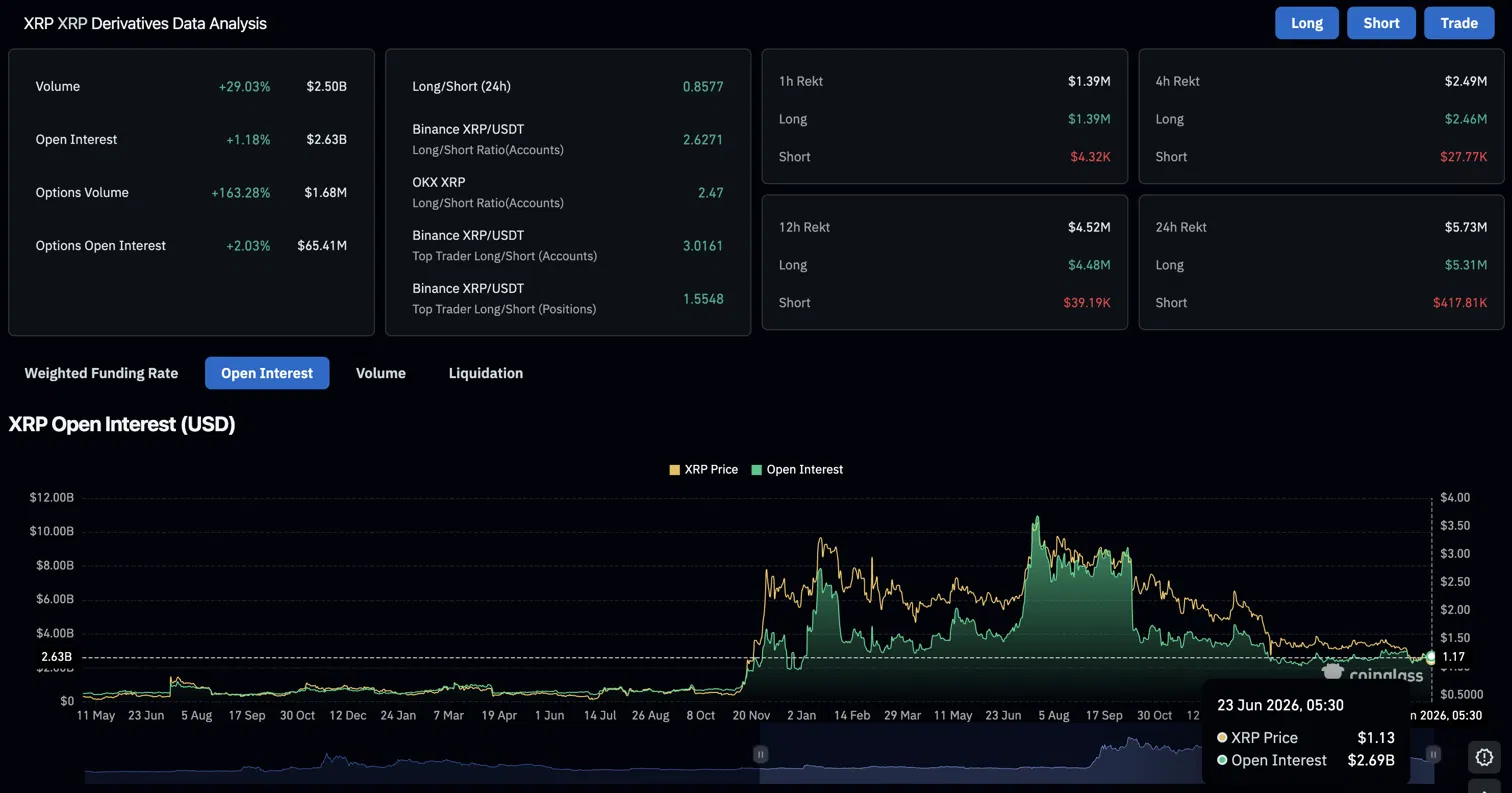
Volume rose 29.03% to $2.50B while open interest climbed 1.18% to $2.63B, both increasing together and pointing to fresh positions entering the market rather than existing ones closing. Options volume surged 163.28% to $1.68M, signaling traders are increasingly using defined-risk structures heading into this range test.
The long/short ratio of 0.8577 leans bearish. Over 24 hours, $417.81K in short positions were liquidated against $5.31M in longs, meaning longs are actually absorbing the larger share of pain here despite the bearish ratio, a sign leveraged buyers keep getting caught on failed bounces inside the range.
XRP Price Prediction for June 24, 2026
- Upside: A hold above $1.10 and a reclaim of $1.1715 would signal range support is finally holding, opening a path back toward $1.20. Continued ETF inflows at the current pace would reinforce that case if they persist through the week.
- Downside: A daily close below $1.0509 breaks the range entirely and exposes a move toward $1.00 with limited technical support beneath it. Persistent spot market outflows outside the ETF wrapper remain the bigger risk factor if that selling pressure accelerates.
Related: Arcium Price Prediction: ARX Doubles in Hours as Upbit Listing Goes Live Today
Disclaimer: The information presented in this article is for informational and educational purposes only. The article does not constitute financial advice or advice of any kind. Coin Edition is not responsible for any losses incurred as a result of the utilization of content, products, or services mentioned. Readers are advised to exercise caution before taking any action related to the company.

")


