


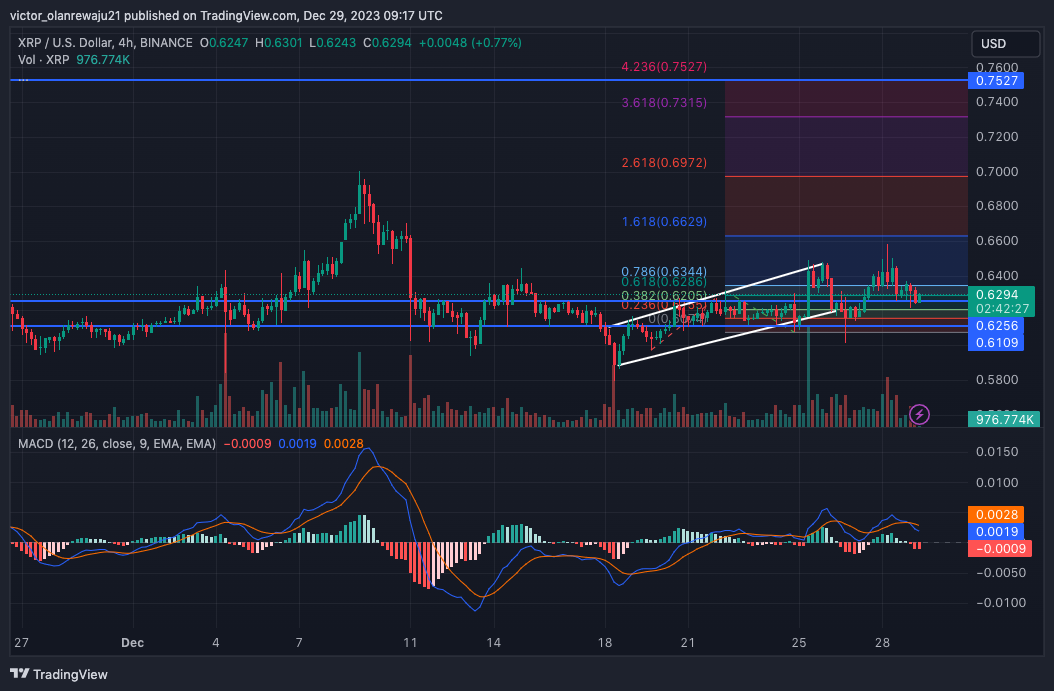
- The Fib extension showed that XRP may rise to $0.75 as a first target.
- Should the 12 EMA flip the 26 EMA, XRP’s momentum may turn bullish.
- XRP’s potential to reach $1 may not happen in a few weeks but it remains feasible in 2024.
Although the numerous $1 price predictions that Ripple (XRP) may not have come to pass, the token might be getting set for a big move. Between December 18 and 26, XRP formed an ascending channel per the 4-hour chart.
During that time, the cryptocurrency breached the $0.61 and $0.62 resistance before touching $0.64. At the time of writing, XRP’s price had decreased to $0.62, as shown by the TradingView chart below.
However, the decline does not imply that the token will continue to hover around the $0.60 region in the coming week. Coin Editon then checked out the Auto-Fibonacci extension.
Entries Are Around $0.62
As of this writing, the 0.382 Fib level was at $0.62. This indicates that the $0.62 region could be a good entry-level for XRP. Furthermore, the 4.236 Fib extension revealed that XRP has the potential to hit $0.75 in the near term.
But to hit the mentioned price, accumulation has to be intense and bulls have to neutralize the presence of bears. At press time, the Moving Average Convergence Divergence (MACD) was negative, suggesting a bearish momentum.
However, indications from the MACD showed that the 12 (blue) and 26 (orange) EMAs were in a tussle for dominance. Should the 12-day EMA flip the 26 EMA, then bulls may have a chance at dictating XRP’s direction.
XRP Bullish Bias Appears
Indications from the Directional Movement Index (DMI) also showed signs that XRP’s forthcoming move could be explosive. At press time, the negative DMI (red) was 14.48. On the other hand, the positive DMI (green) was 18.57.
This position indicated that there were more buyers than sellers. So, XRP has more potential to rise in the short term than to decrease.
However, the reading of the Average Directional Index (ADX) could be vital to XRP’s movement, As of this writing, the ADX (yellow) was 16.11. But for XRP’s price to increase substantially, the ADX reading needs to hit 25 or above.
If the ADX rises that high, buyers also need to maintain dominance. This is to ensure the validation of the northward move. Furthermore, the Relative Strength Index (RSI) had crossed the 50.00 mark.
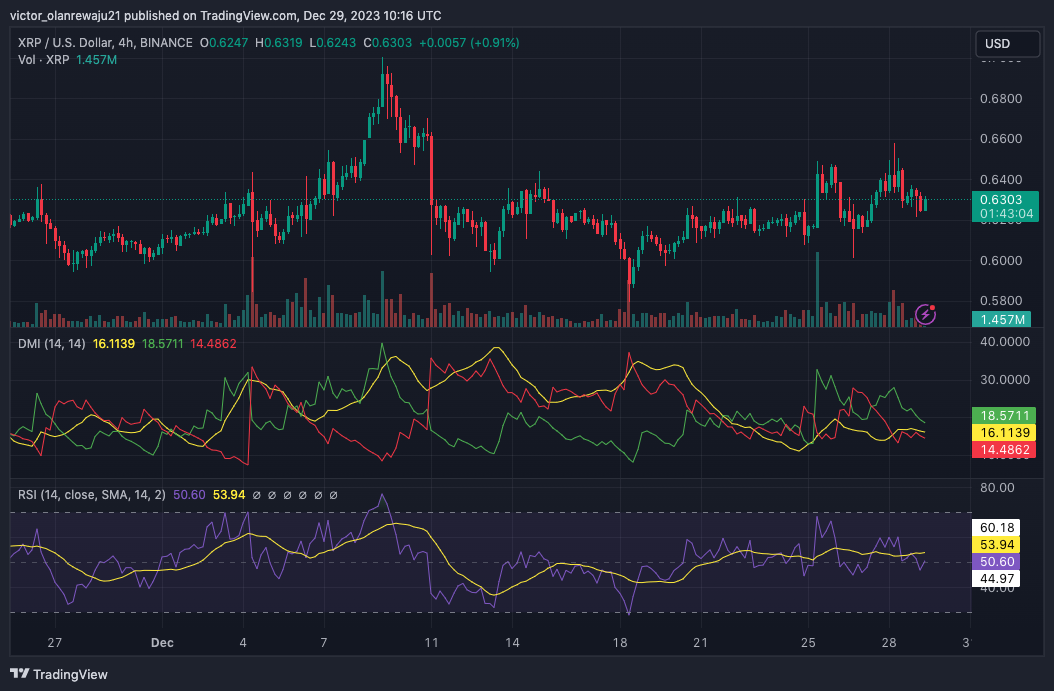
The crossover of the midpoint suggests rising bullish momentum. Should buying pressure increase, then XRP may have a shot at $1. However, this could take more than a few weeks to achieve, and buyers will have to maintain strong momentum.
Disclaimer: The information presented in this article is for informational and educational purposes only. The article does not constitute financial advice or advice of any kind. Coin Edition is not responsible for any losses incurred as a result of the utilization of content, products, or services mentioned. Readers are advised to exercise caution before taking any action related to the company.
 Price Prediction: Can BTW Sustain Its Breakout Above $0.1032?")


