


- Zilliqa price analysis today yields a bearish trend.
- The cryptocurrency has found support at $0.01843, which currently holds.
- The nearest resistance for ZIL/USD is at $0.02053.
The Zilliqa price analysis is showing bears are in the lead today. As the market opened, bears gained strength and drove the price down to the $0.01906 range, where ZIL recently found support, and bulls are attempting to take control, but it appears that they may fail. Previously, the coin was showing bullish momentum after the steep crashes observed after December 15, 2022. However, the cryptocurrency is finding it hard to break above the resistance level of $0.02053, as the coin faced rejection at this level for the third time.
The 1-day price chart for Zilliqa price analysis shows that the ZIL bulls are trying hard to take over the price function, but bearish supremacy is still dominating today’s price action. The ZIL/USD has decreased by 6.51% in the past 24 hours. The trading volume is at $26,229,192, which is lower than the usual trading volumes, while the market cap stands at $303,441,995.
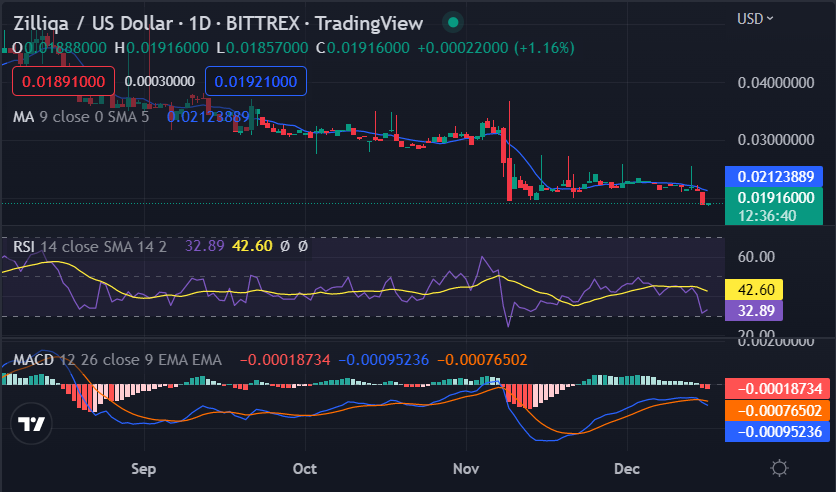
The technical indicators used for the analysis are indicating a bearish trend as the MACD line has crossed below the signal line and the RSI is at 40.59, which suggests that the market is slightly oversold. The moving average (MA) is also traveling below the price level, which is currently a bearish sign.
The 4-hour Zilliqa price analysis chart shows the bears caused heavy damage during the first four hours of the trading session today, The day started with selling pressure, and the bears provided resistance and took over the market for the first four hours. They may continue in the coming hours as well, but bulls may take the charge again.
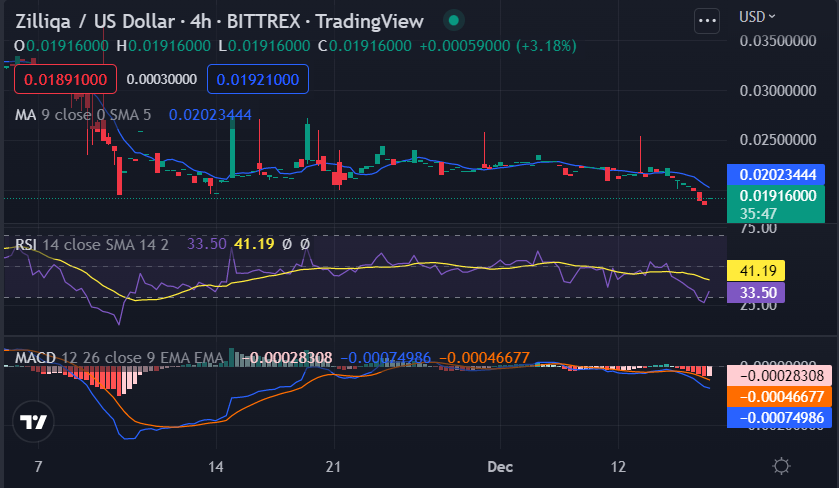
The moving average (MA) is traveling below the price level and the current resistance is at $0.02053. If the price breaks above this level then we may see a bullish rally in the coming hours. The MACD on the 4-hour chart is below the signal line, which is a bearish sign with histogram bars declining. The RSI is at 40.59, which suggests that the market is slightly oversold and a pullback may be seen in the coming hours.
To conclude the 1-day and 4-hour Zilliqa price analysis show a bearish trend for today with clear signs of bearish shadows, but bulls are trying to take over at the moment. Further down the line today, if the buying momentum gains strength, then bulls may succeed in carrying the lead as the support is also present nearby, but if selling pressure accelerates again, then bears may stretch the leg and take cryptocurrency further down towards the support level of $0.01843.
Disclaimer: The information presented in this article is for informational and educational purposes only. The article does not constitute financial advice or advice of any kind. Coin Edition is not responsible for any losses incurred as a result of the utilization of content, products, or services mentioned. Readers are advised to exercise caution before taking any action related to the company.


