


- Aptos price analysis is bullish on the chart, as it is trading above the $18.49 level.
- The price is up 2.04% since the previous session and continues to move higher.
- The resistance level for APT/USD is currently at the $18.76 level.
Recent Aptos price analysis shows a bullish trend in the market. The price has broken out of an ascending triangle pattern, which indicates a strong buying sentiment. APT/USD opened today’s trading section in a bearish trend, but quickly recovered and moved higher.
The selling pressure had pushed the price down to the $17.62 level, where it found strong support and reversed its course. However, the bullish pressure is still strong, as the price has moved above the $18.49 level.
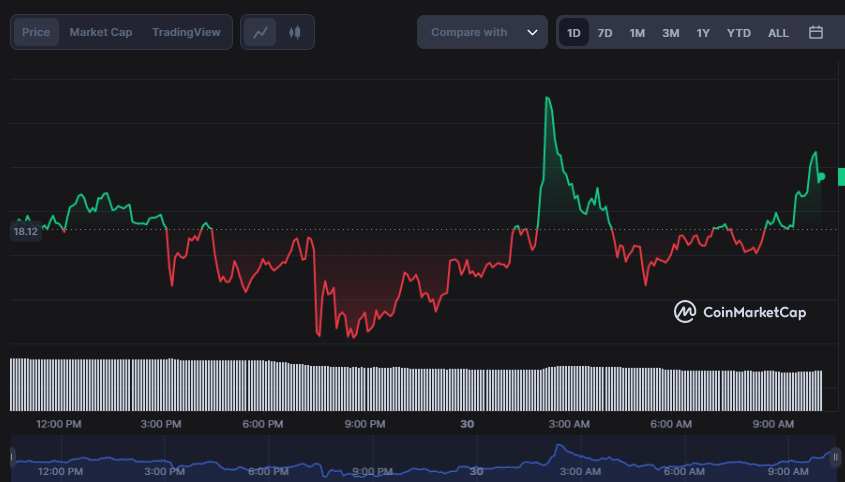
Aptos price movement: CoinmarketcapThe 24-hour chart for the Aptos token shows an increase in the buying momentum after a bullish run that started a few hours ago. The APT/USD is up 2.04% since the previous session and is trading around $18.76 at the time of writing. The market cap of the Aptos token stands at $2.96 billion and the 24-hour trading volume stands at $901 million, indicating that the market has plenty of liquidity with more buyers entering the market.
The altcoin has seen major support from the 50-day moving average, which has been pushing the price higher over the last few hours. The 200-day moving average is also providing strong support, which indicates that the buying pressure will remain strong in the market.
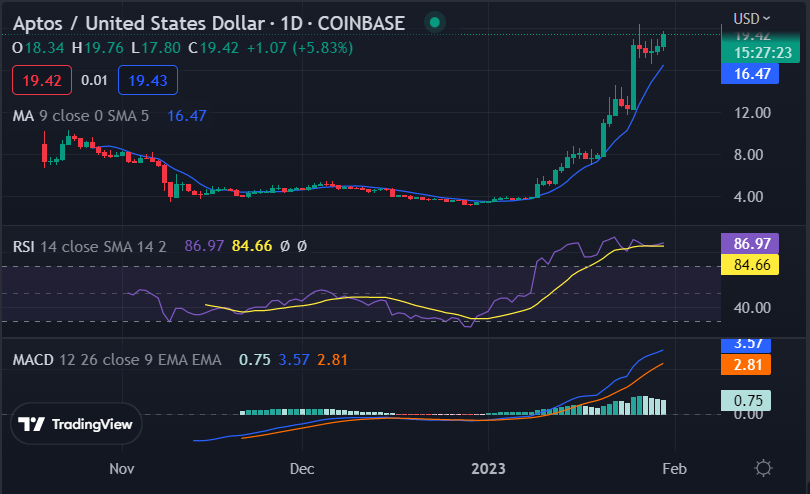
APT/USD 24-hour price chart: TradingViewThe Relative Strength Index (RSI) for APT/USD is currently at 84.66 and indicates that the price momentum is still favoring an uptrend in the near term. The Moving Average Convergence Divergence (MACD) is also continuing to show a bullish trend. The MACD line (blue) has crossed above the signal line (orange), giving an indication of more upside in the price.
Looking at the 4-hour chart, the Aptos token is trading near an important resistance level at $18.76. A successful break above this level could lead to further gains in the market with a target of $19.00 as the next psychological hurdle for buyers. On the downside, if buyers fail to sustain their bullish momentum, then APT/USD might face selling pressure and could correct toward the $17.62 level.
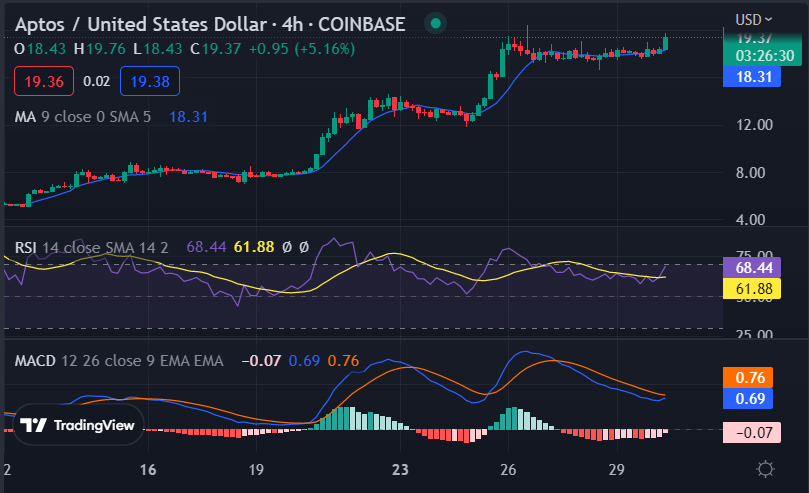
APT/USD 4-hour price chart: TradingViewLooking at the technical indicators, the MACD is in positive territory and shows a bullish crossover, indicating that the buying pressure is likely to continue in the near term. The RSI (relative strength index) is also in positive territory and above the 50 level which indicates strong bullish momentum. The moving average indicator is currently at $18.31 and continues to move up, which indicates further upside in the price of the Aptos token.
Overall, Aptos price analysis is bullish in the near term. The token is trading above the important support levels and has seen major buying momentum over the last few days which indicates that buyers are likely to remain in control of the market in the near term. For traders, it is important to keep an eye on the $18.76 resistance level for further insights into the price action.
Disclaimer: The views and opinions, as well as all the information shared in this price prediction, are published in good faith. Readers must do their research and due diligence. Any action taken by the reader is strictly at their own risk. Coin Edition and its affiliates will not be held liable for any direct or indirect damage or loss.
Disclaimer: The information presented in this article is for informational and educational purposes only. The article does not constitute financial advice or advice of any kind. Coin Edition is not responsible for any losses incurred as a result of the utilization of content, products, or services mentioned. Readers are advised to exercise caution before taking any action related to the company.


