


- Solana remains below key EMAs, keeping broader trend structure firmly bearish bias.
- SOL holds $65 support while resistance near $69 keeps recovery momentum limited.
- Derivatives activity cooled as open interest fell, signaling cautious but active traders.
Solana (SOL) continues to show signs of stabilization after months of intense selling pressure, although technical indicators suggest the broader trend remains fragile. The cryptocurrency recently bounced from a major swing low near $60 and now trades around $66.
Market participants have started to monitor whether this recovery can develop into a stronger reversal. However, SOL still sits below several important resistance levels, keeping traders cautious despite improving market conditions.
Technical Structure Remains Under Pressure
The four-hour chart highlights a market that remains trapped beneath key moving averages. SOL currently trades below the 20, 50, 100, and 200 exponential moving averages, reflecting lingering bearish control. Moreover, the alignment of these averages continues to favor sellers.
Immediate support stands near $65.59, a level that coincides with the 0.236 Fibonacci retracement. Below that, a demand zone between $63 and $64 could provide temporary relief. The most important support remains the $60.17 swing low, which marked the recent recovery point.
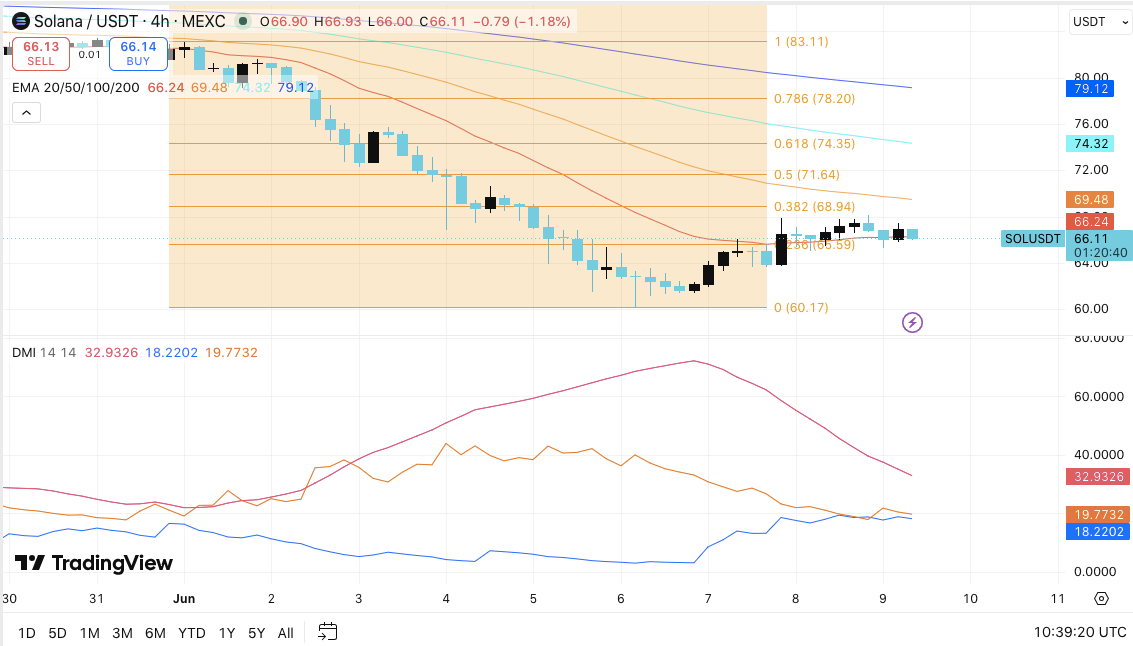
On the upside, resistance begins near $66.24 and extends toward the critical $68.94 to $69.48 region. A decisive break above this zone could shift sentiment significantly. Consequently, traders would likely target the next resistance levels near $71.64 and $74.35.
Related: XRP Price Prediction: Options Volume Explodes 104% as XRP Tests Its Last Weekly Support
Momentum indicators present a mixed picture. The Average Directional Index remains elevated, suggesting the prevailing trend still carries strength. However, the narrowing gap between directional indicators points to weakening bearish momentum and a growing consolidation phase.
Open Interest Signals a More Balanced Market
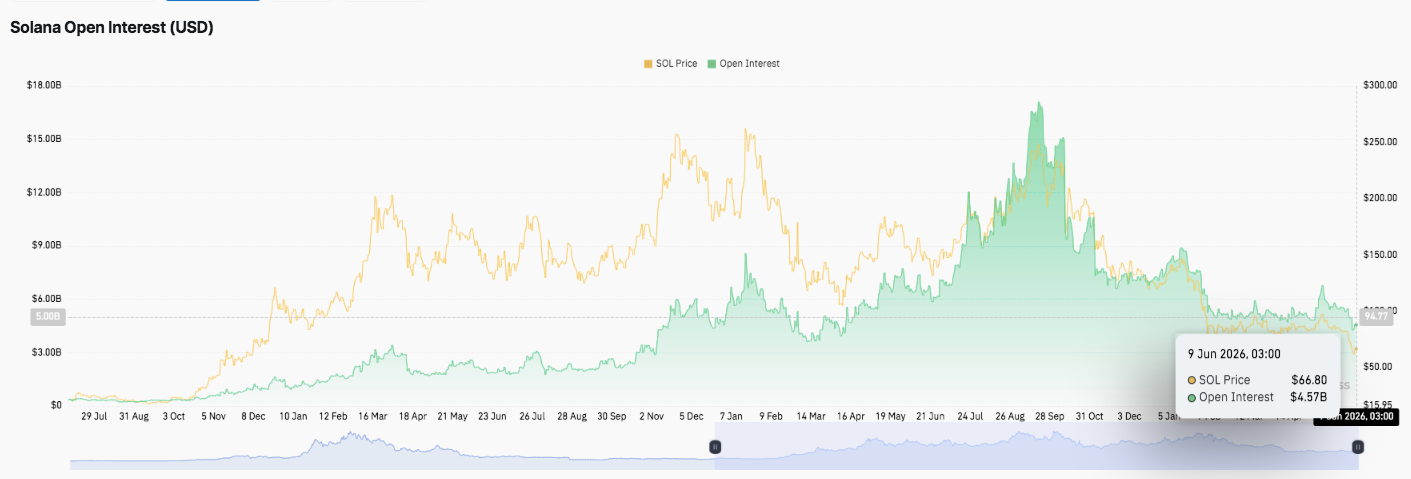
Derivatives data reveals a notable shift in trader behavior. Open interest surged aggressively during Solana’s previous rally and peaked near $17 billion as speculative activity intensified.
That environment has changed considerably. Large leveraged positions exited the market during the subsequent downturn, causing open interest to decline sharply. Since then, derivatives activity has settled within a narrower range between roughly $4.5 billion and $6 billion.
The latest reading near $4.57 billion suggests traders remain engaged but selective. Additionally, market participants appear reluctant to increase leverage until a clearer directional trend emerges.
Exchange Flows Point to Improving Sentiment
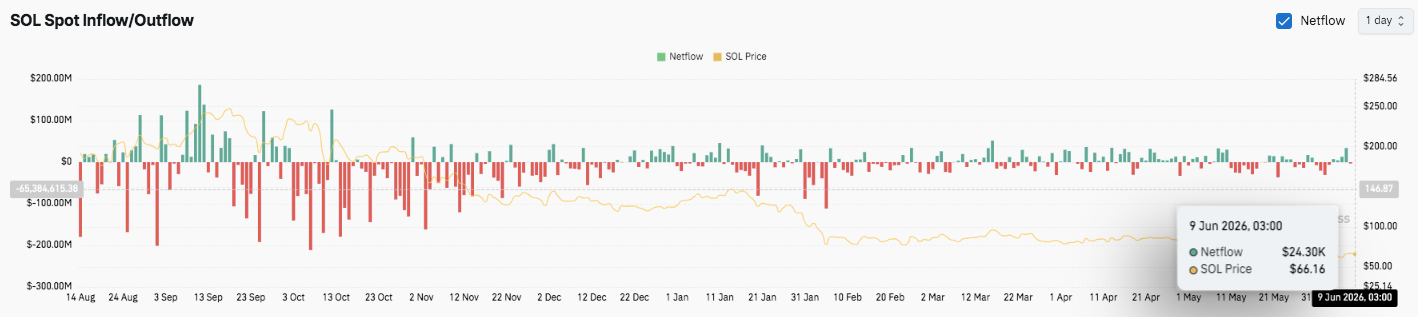
Spot market activity also paints a more constructive picture. Large exchange outflows dominated much of the previous decline, reflecting persistent selling pressure. However, netflows have gradually normalized during recent months.
Since March, inflows and outflows have remained relatively balanced. Recent sessions even recorded moderate net inflows, indicating growing accumulation interest. Moreover, reduced exchange selling pressure has helped stabilize price action.
While Solana has not yet confirmed a full trend reversal, improving exchange flows and steadier derivatives positioning suggest market confidence is slowly returning.
Technical Outlook for Solana Price
Key levels remain crucial as Solana attempts to build on its recent recovery from the $60 support zone:
Upside levels: $66.24 (20 EMA), followed by $68.94 and $69.48 as the first major resistance cluster. A successful breakout above these levels could open the door toward $71.64 and the key $74.35 Fibonacci resistance zone.
Downside levels: $65.59 serves as immediate support, followed by the $64.00–$63.00 demand area. Below that, the critical $60.17 swing low remains the line that bulls must defend.
Resistance ceiling: The $68.94–$69.48 region represents the most important near-term hurdle. Reclaiming this zone would strengthen the recovery narrative and improve the medium-term outlook.
The technical structure suggests SOL is transitioning from a strong downtrend into a consolidation phase. While bearish pressure persists below major moving averages, weakening downside momentum and stabilizing derivatives activity indicate that sellers are losing some control.
Will Solana Go Up?
Solana’s near-term outlook depends on whether buyers can push the price above the $68.94–$69.48 resistance cluster. A confirmed breakout could attract fresh momentum traders and support a move toward $71.64 and potentially $74.35. Improving exchange flows and reduced selling pressure provide additional support for a bullish scenario.
However, failure to hold $65.59 could shift sentiment back in favor of sellers. In that case, SOL may revisit the $63 zone and potentially retest the major support at $60.17.
Related: Ethereum Price Prediction: ETH Crashed 68% and the Last Time This Happened Bulls Made 5x
For now, Solana remains at a pivotal technical crossroads. Market participation has stabilized, exchange flows have improved, and bearish momentum is fading. The next decisive move above resistance or below support will likely determine SOL’s direction for the weeks ahead.
Disclaimer: The information presented in this article is for informational and educational purposes only. The article does not constitute financial advice or advice of any kind. Coin Edition is not responsible for any losses incurred as a result of the utilization of content, products, or services mentioned. Readers are advised to exercise caution before taking any action related to the company.
 Price Prediction 2026, 2027, 2028, 2029, 2030 -2050")


