


 Price Prediction 2023-2030: Will ANT Price Hit $10 Soon?")
- Bullish ANT price prediction ranges from $1.00 to $9.00.
- Analysis suggests that the ANT price might reach $8.7.
- The ANT bearish market price prediction for 2023 is $1.55.
Table of contents
- Aragon (ANT) Market Overview
- What is Aragon (ANT)?
- Analysts’ View on Aragon (ANT)
- Aragon (ANT) Current Market Status
- Aragon (ANT) Price Analysis 2023
- Aragon (ANT) Price Prediction 2023-2030 Overview
- Aragon (ANT) Price Prediction 2023
- Aragon (ANT) Price Prediction 2024
- Aragon (ANT) Price Prediction 2025
- Aragon (ANT) Price Prediction 2026
- Aragon (ANT) Price Prediction 2027
- Aragon (ANT) Price Prediction 2028
- Aragon (ANT) Price Prediction 2029
- Aragon (ANT) Price Prediction 2030
- Aragon (ANT) Price Prediction 2040
- Aragon (ANT) Price Prediction 2050
- Conclusion
- FAQ
- More Crypto Price Predictions:
Aragon (ANT) Market Overview
HTTP Request Failed... Error: file_get_contents(https://pro-api.coinmarketcap.com/v2/cryptocurrency/quotes/latest?slug=aragon): Failed to open stream: HTTP request failed! HTTP/1.1 429 Too Many RequestsWhat is Aragon (ANT)?
Aragon is a DAO framework that builds tools for creating, managing, and scaling tools for everyone to experiment with governance at the speed of software. The Aragon Project is governed by ANT Holders in a delegated voting DAO. ANT is an ERC-20 token, that is used to govern the Aragon DAO.
Aragon was founded in 2016 by Luis Cuende and Jorge Izquierdo. As per the purpose of Aragon mentioned on a manifesto of Aragon’s website, it states:
“We believe humankind should use technology as a liberating tool to unleash all the goodwill and creativity of our species, rather than as a tool to enslave and take advantage of one another.
Thus, Aragon is a fight for freedom. Aragon empowers freedom by creating liberating tools that leverage decentralized technologies.”
Analysts’ View on Aragon (ANT)
Bitget a derivatives platform tweeted that ANT was rallying after its Co-founder decided to buy back 30 million tokens.
Aragon (ANT) Current Market Status
Aragon has a circulating supply of 40,029,852 ANT coins, while its maximum supply is unavailable according to CoinMarketCap. At the time of writing, ANT is trading at $3.98 representing 24 hours decrease of 4.38%. The trading volume of ANT in the past 24 hours is $8,597,806 which represents a 96.65% increase.
Some top cryptocurrency exchanges for trading ANT are Binance, OKX, Bitrue, Bybit, and WEEX.
Now that you know ANT and its current market status, we shall discuss the price analysis of ANT for 2023.
Aragon (ANT) Price Analysis 2023
Currently, Aragon (ANT) ranks 159 on CoinMarketCap. Will ANT’smost recent improvements, additions, and modifications help its price go up? First, let’s focus on the charts in this article’s ANT price forecast.
Aragon (ANT) Price Analysis – Bollinger Bands
The Bollinger bands are a type of price envelope developed by John Bollinger. It gives a range with an upper and lower limit for the price to fluctuate. The Bollinger bands work on the principle of standard deviation and period (time).
The upper band as shown in the chart is calculated by adding two times the standard deviation to the Simple Moving Average while the lower band is calculated by subtracting two times the standard deviation from the Simple Moving Average. When the bands widen, it shows there’s going to be more volatility and when they contract, there is less volatility.
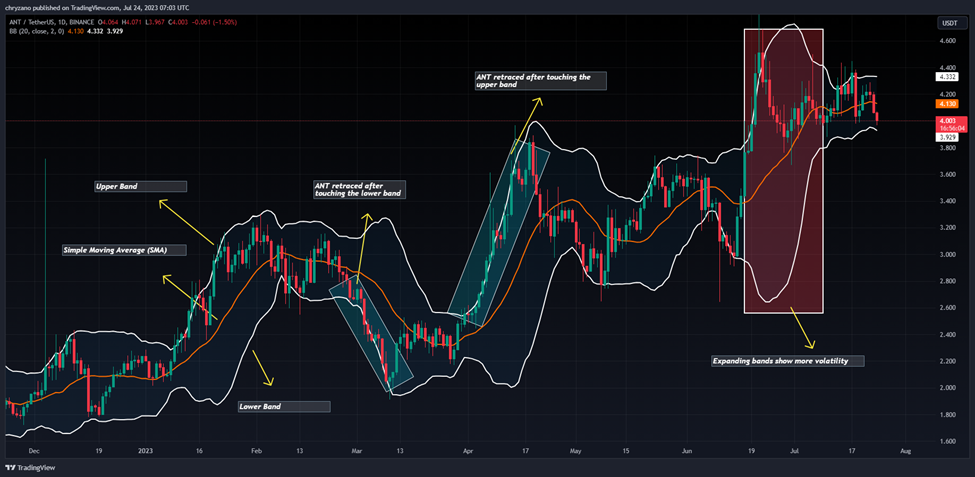
When Bollinger bands are used in a cryptocurrency chart, we could expect the price of the cryptocurrency to reside within the upper and lower bounds of the Bollinger bands 95% of the time. The above thesis is derived from an Empirical law.
The sections highlighted by red rectangles in the chart above show how the bands expand and contract. When the bands widen, we could expect more volatility, and when the bands contract, it denotes less volatility. The green rectangles show how ANT retraced after touching the upper band (overbought) and the lower band (oversold).
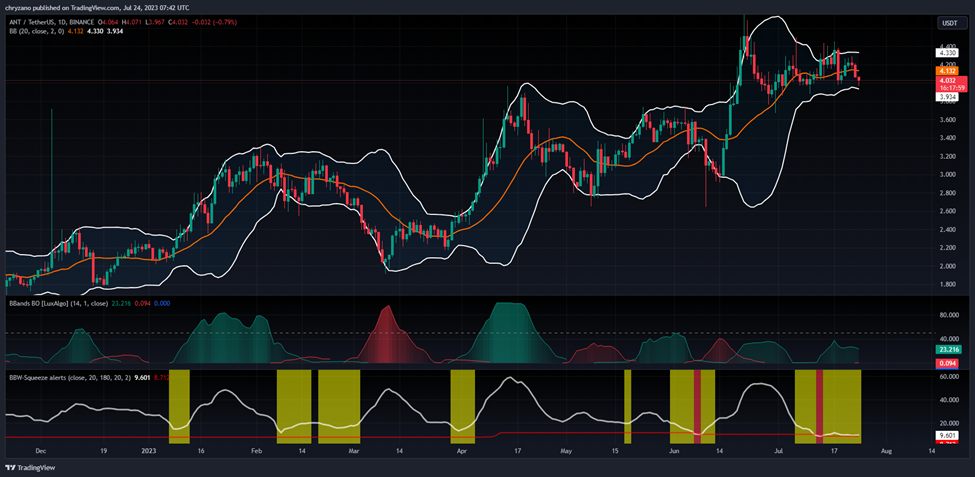
Currently, the Bollinger bands are squeezing, hence, ANT is fluctuating within a tight space. As ANT is just below the SMA, it could be expected to reach for support from the lower Bollinger band. Moreover, the Bolinger band Breakout indicator reads a bearish value of 0.133 while the bullish value is 23.251, since the bullish value is greater than the bearish value, ANT is in a strong bullish trend.
Meanwhile, when taking a look at the Bollinger Bandwidth squeeze indicator, we could see that the yellow bars indicate when the bandwidth reduces below 20 on the BBW indicator. The red line bars show the bandwidth reducing to its lowest value. Currently, the Bandwidth is at 9.209 while the lowest bandwidth for ANT has been 6.980. Since the BBW indicator is placed parallel to the horizontal axis, the bandwidth may remain constant.
Aragon (ANT) Price Analysis – Relative Strength Index
The Relative Strength Index is an indicator that is used to find out whether the price of a security is overvalued or undervalued. As per its name, RSI indicators help determine how the security is doing at present, relative to its previous price.
Moreover, it has a signal line which is a Simple Moving Average (SMA) that acts as a yardstick or reference to the RSI line. Hence, whenever the RSI line is above the SMA, it is considered bullish; if it’s below the SMA, it is bearish.
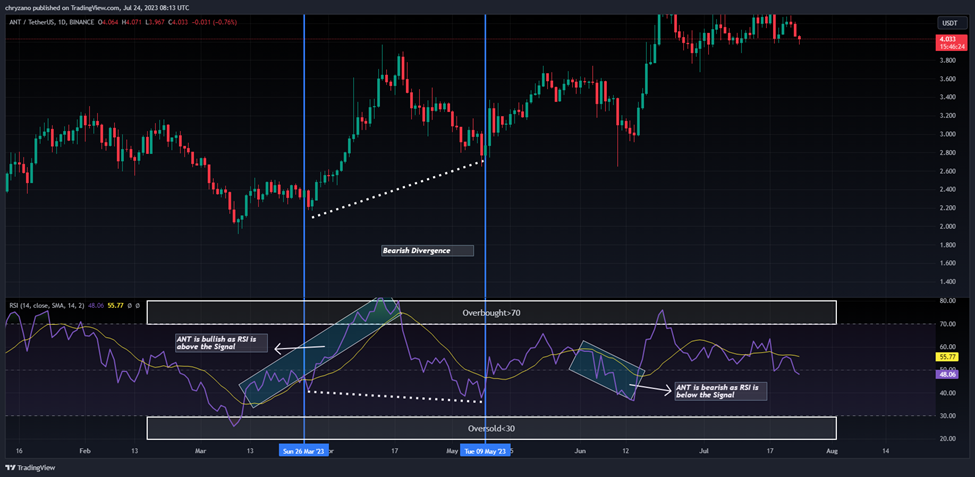
Currently, the RSI read a value of 48.06 and it is under the Signal. As such, although the RSI is neither overbought nor oversold, ANT is bearish. This is because ANT had more red candlesticks compared to green candlesticks. However, when accumulated the sum of the green candlesticks seems to be less than the sum of the red candlesticks. As such, ANT is bearish.
Moreover, the above chart indicates a bearish divergence. This is symbolized by the ANT’s behavior whereby it made higher lows when the RSI made lower lows.

The above chart shows the RSI Multi length indicator reading a value of 43.3. This indicator plots the difference between the maximum and minimum length as an average. Since the indicator is neither overbought nor oversold, the trend could be considered strong. However, since the RSI is facing downwards, ANT may drop in prices and the RSI could reach 28, which has been the least value the RSI has fallen in the recent past.
If the preceding is to happen then ANT might seek support from the Crossunder Oversold region (Pale Red). However, if the bulls manage to redeem ANT, there it may test the Crossunder overbought level (yellow line) one more time. However, if it manages to break above the afore mentioned level, then it may test the Crossover overbought zone.
Aragon (ANT) Price Analysis – Moving Average
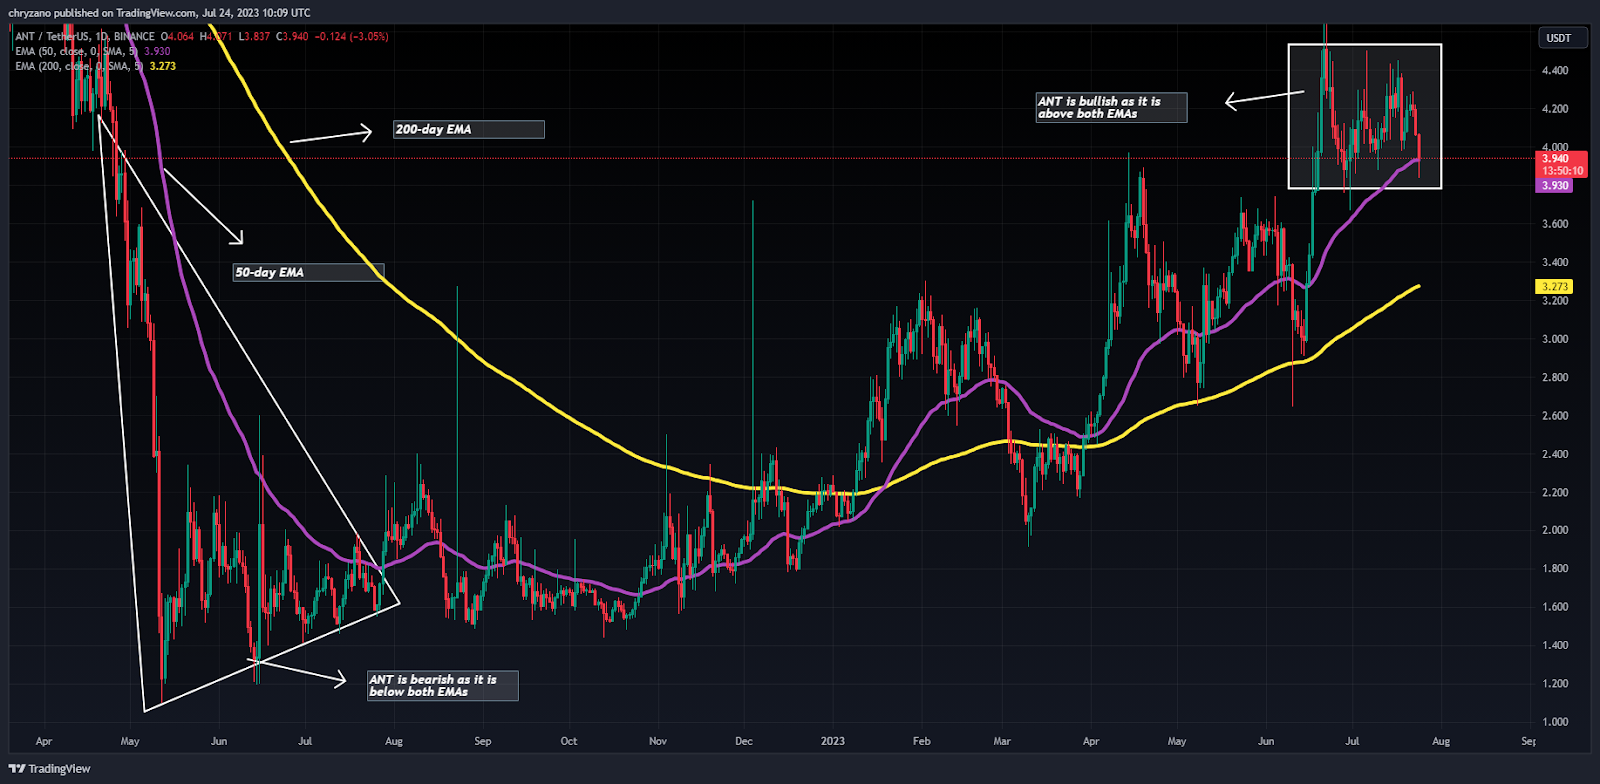
The Exponential Moving averages are quite similar to the simple moving averages (SMA). However, the SMA equally distributes down all values whereas the Exponential Moving Average gives more weightage to the current prices. Since SMA undermines the weightage of the present price, the EMA is used in price movements.
The 200-day MA is considered to be the long-term moving average while the 50-day MA is considered the short-term moving average in trading. Based on how these two lines behave, the strength of the cryptocurrency or the trend can be determined on average.
In particular, when the short-term moving average (50-day MA) approaches the long-term moving average (200-day MA) from below and crosses it, we call it a Golden Cross.
Contrastingly, when the short-term moving average crosses the long-term moving average from above then, a death cross occurs.
Usually, when a Golden Cross occurs, the prices of the cryptocurrency will shoot up drastically, but when there’s a Death Cross, the prices will crash.
Currently, ANT is bullish as it is above both EMA and at the moment it is seeking support from the 50-day EMA. However, based on past observations, the 50-day EMA hasn’t been a support level for EMA but the 200-day EMA has been. Hence, if ANT keeps on decreasing, it may seek the support of the 200-day. We may see ANT once again up above the 50-day EMA if it ricochets off of the 200-day EMA.
Aragon (ANT) Price Analysis – Elder Force Index
Elder Force Index is an indicator that was invented by Alexander Elder, who was an entrepreneur. The indicator mainly uses two parameters to adjudicate the buying and selling force and thereby predicts the market trend. In particular, it relies on price change and volume. As such the strength of the buying force or selling force is dependent on either the price change or the volume.
Whenever the EFI is greater than zero, or positive, we could say that the trend is bullish, as there is more buying pressure. However, when the EFI is in the negative zone, we could say that the cryptocurrency is in the negative zone and the selling pressure is more
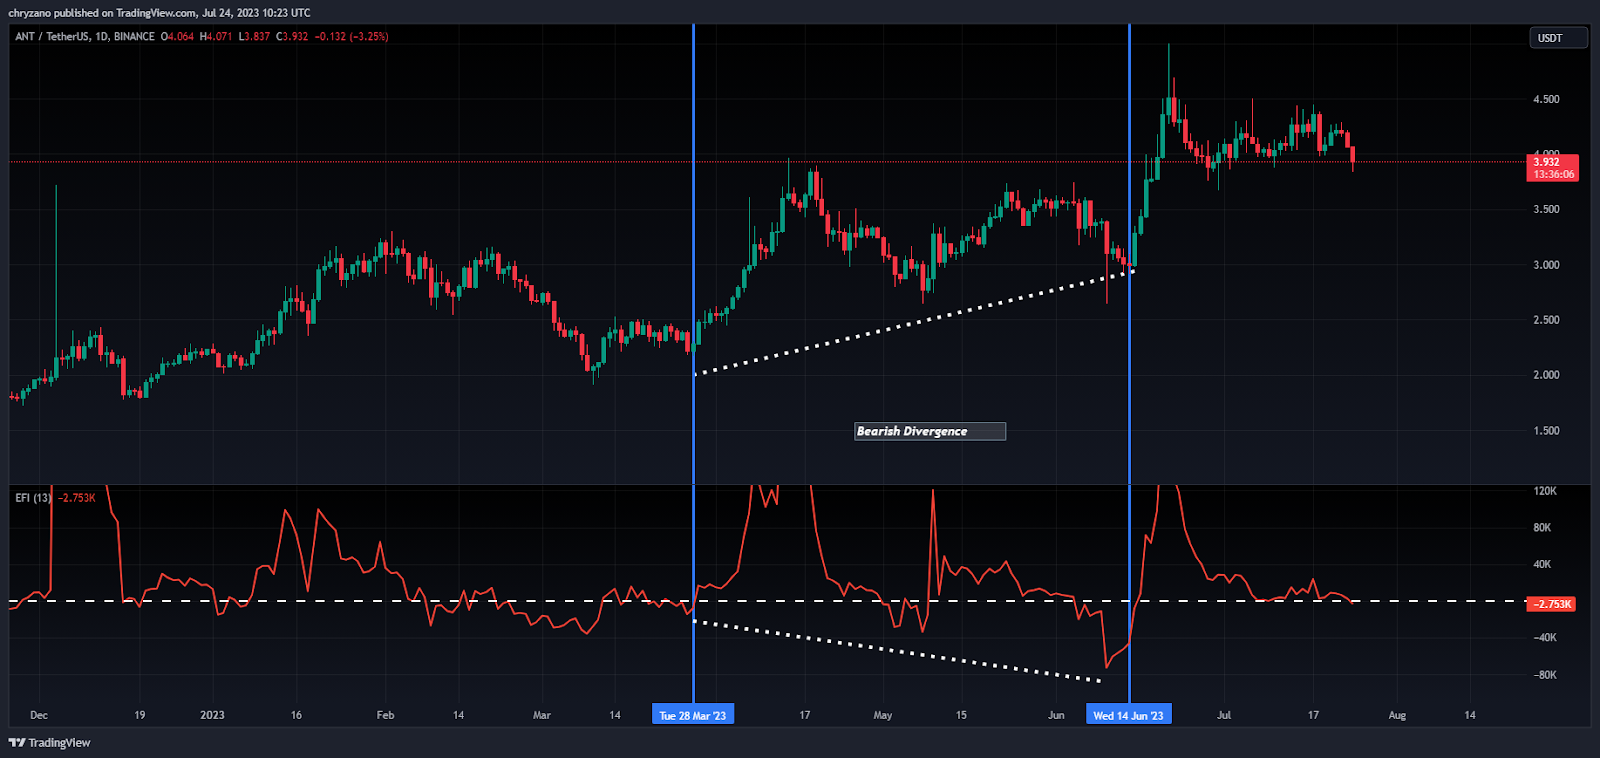
The chart above shows a bearish divergence. This is because the ANT was making higher lows while the EFI was making lower lows. Currently, the EFI reads a value of -3.043K, and the line is tilting downwards. Hence, the EFI could further fall if the buyers don’t come to the rescue.
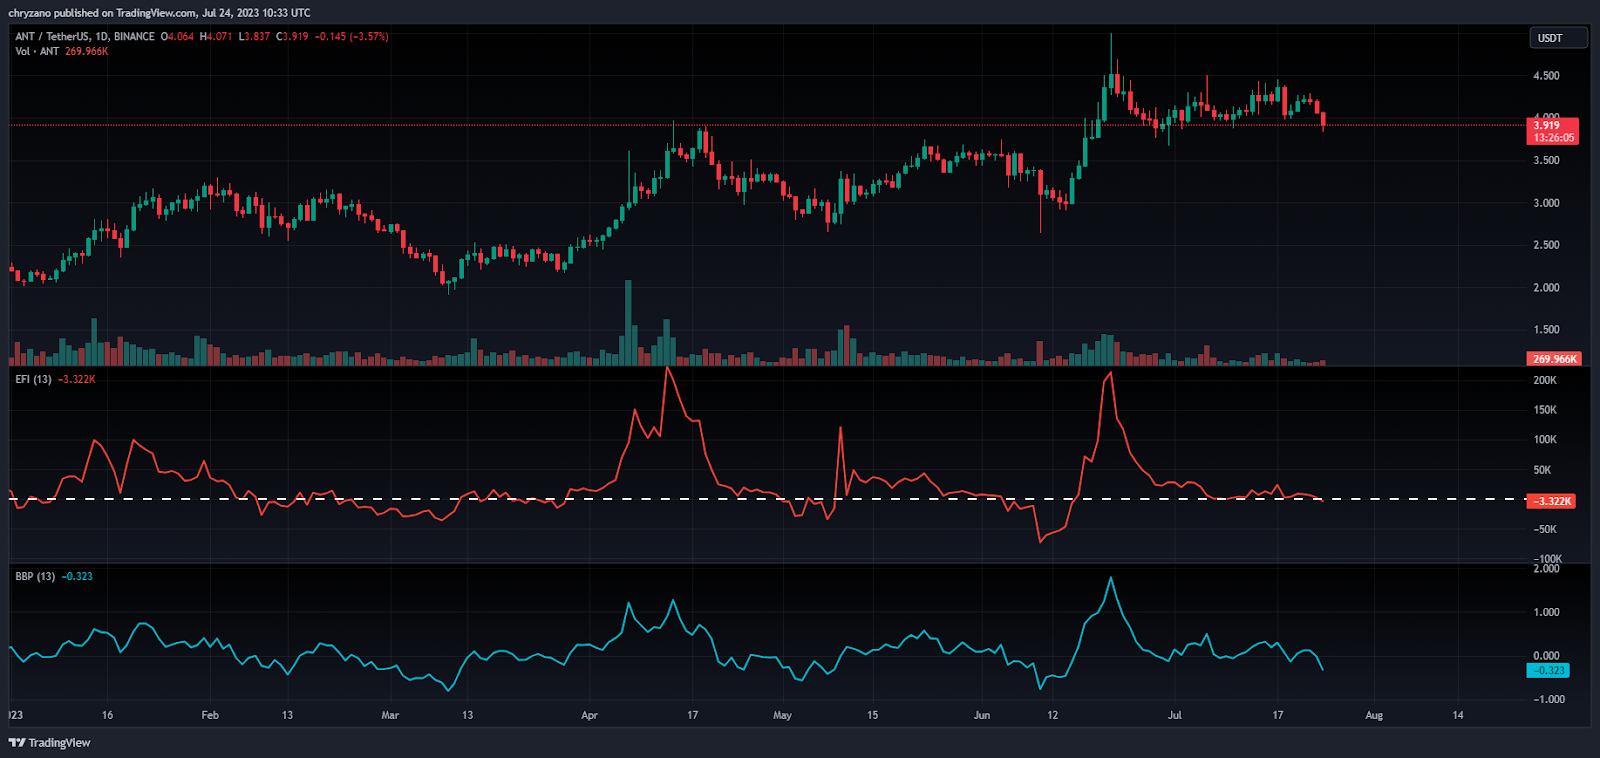
The Bull-Bear-Power (BBP) indicator also confirms that the bears have the upper hand in the market. BBP reads a value of -0.323. Moreover, the volume has been quite constant as per the volume MA. This indicates that the change in price hasn’t been supported by the volume. Hence, there could be a trend change.
Aragon (ANT) Price Prediction 2023-2030 Overview

| Year | Minimum Price | Average Price | Maximum Price |
| 2023 | $7.5 | $8.69 | $10.25 |
| 2024 | $11.75 | $14.411 | $16.75 |
| 2025 | $18.5 | $19.643 | $22.5 |
| 2026 | $7.95 | $9.63 | $12.5 |
| 2027 | $12.00 | $13.447 | $15.5 |
| 2028 | $16.25 | $17 | $18.9 |
| 2029 | $25.5 | $28.746 | $31.25 |
| 2030 | $22.5 | $24.3881 | $27.25 |
| 2040 | $40.15 | $43.95 | $50.5 |
| 2050 | $60 | $65.1395 | $80 |
Aragon (ANT) Price Prediction 2023
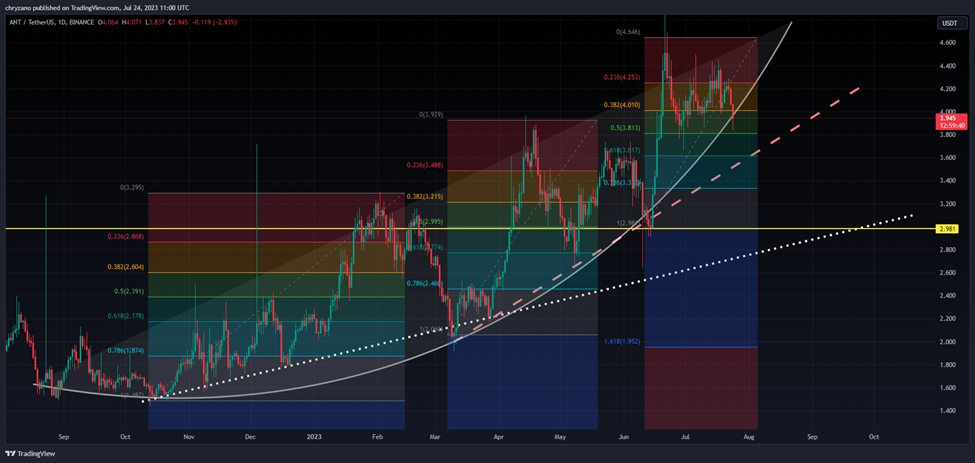
Considering the chart above, we could see that ANT was on an exponential rise since September 2022. Moreover, the tangent line constructed at the edge of the curve shows the increasing gradient of ANT.
When the whole exponential rise is trisected with the Fibonacci retracement tool, we could delve into the mechanics of each spike. For instance, the first two Fibonacci retracements from the left show ANT seeking support at 0.786 and 0.618 retracement levels. As such, if ANT is to be dismantled off of its exponential rise, then we could expect to fall to the 0.5 level.
However, in the event that ANT the 0.5 level does not support ANT’s fall, then, we could expect it to reach support from the 0.618 level at Support 1 ($3.711). This is also the region where the broken trend line meets the retracement level. As such, ANT may follow the broken trend line and rise,
In the event that ANT breaks the trend of rising along the broken trendline then it may seek help from Support 2, at $2.916. If support 2 holds ANT, it may be able to rise along the dotted line.
However, if the exponential rise and both trend lines are breached, then ANT may seek support from Support 3 ($2.054), Support 4 ($1.826), and Support 5 ($1.556).
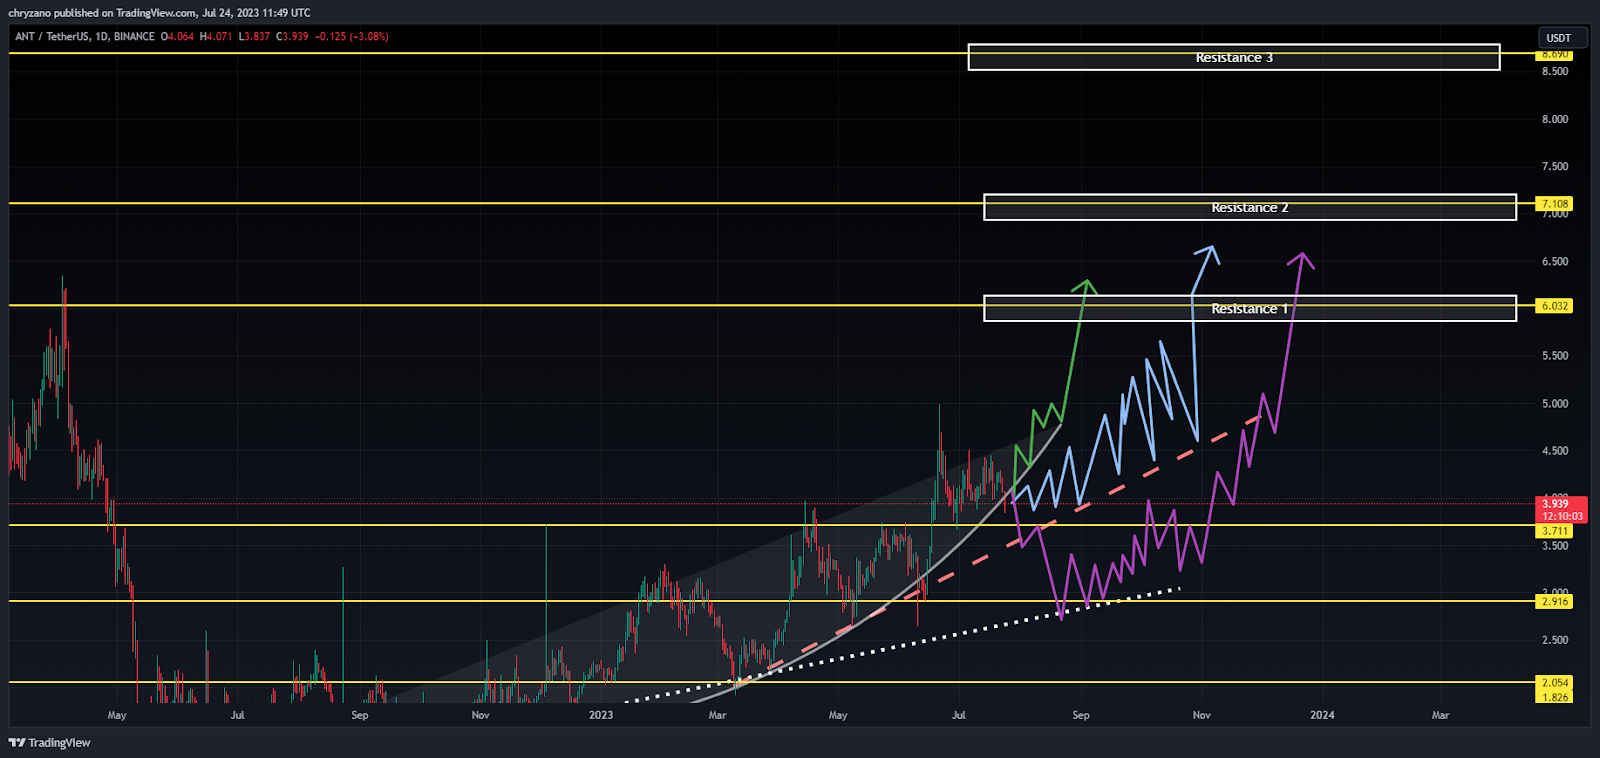
In the event that the exponential rise is maintained, ANT might test Resistance 1 at $6.032. And with more power from the bulls, it might even be able to test Resistance 2 at $7.108 and maybe even Resistance 3 at $8.69. These three Resistance levels could be achieved if ANT rises in the future. But the question is which rising path will ANT choose. Will it choose the exponential rise, the broken trend line, or the dotted lines? If it chooses the exponential rise, the quicker it will rise while if it chooses the broken or the dotted trend line, it will be slower with the latter being the slowest.
Aragon (ANT) Price Prediction – Resistance and Support Levels
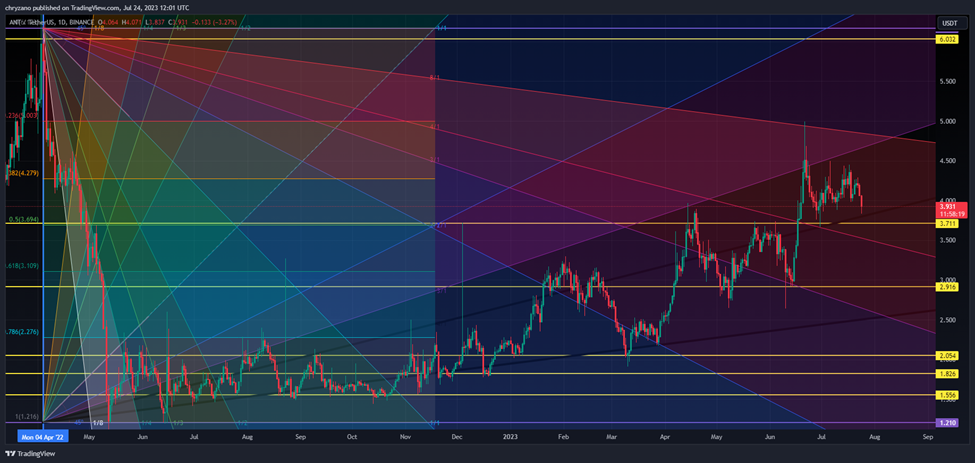
Considering the chart above, it could be noted that ANT fell just below the 1:4 Gann line back in May 2022. However, following the fall ANT went through a period of consolidation from Late May 2022 to mid-November 2022. Come December 2022, ANT was dominated by the bulls who helped ANT rise along the 8:1 Gann line.
At times ANT was able to rise above the 4:1 Gann line, while at other times it sought for support from the 8:1 Gann line. Currently, it has been held from falling by the 4:1 Gann line. However, even in the event that ANT breaches the 4:1 Gann line, there lies support for it at $3.711. If the $3.7 level fails to hold ANT, then it may seek support and slide down along the 3:1 Gann line.
Aragon (ANT) Price Prediction 2024
There will be Bitcoin halving in 2024, and hence we should expect a positive trend in the market due to user sentiments and the quest by investors to accumulate more of the coin. However, the year of BTC halving didn’t yield the maximum ANT based on the previous halving. Hence, we could expect ANT to trade at a price not below $14.4 by the end of 2024.
Aragon (ANT) Price Prediction 2025
ANT may experience the after-effects of the Bitcoin halving and is expected to trade much higher than its 2024 price. Many trade analysts speculate that BTC halving could create a huge impact on the crypto market. Moreover, similar to many altcoins, ANT will continue to rise in 2025 forming new resistance levels. It is expected that ANT would trade beyond the $19.6 level.
Aragon (ANT) Price Prediction 2026
It is expected that after a long period of bull run, the bears would come into power and start negatively impacting the cryptocurrencies. During this bearish sentiment, ANT could tumble into its support regions. During this period of price correction, ANT could lose momentum and be way below its 2025 price. As such it could be trading at $9.6 by 2026.
Aragon (ANT) Price Prediction 2027
Naturally, traders expect a bullish market sentiment after the crypto industry was affected negatively by the bears’ claw. Moreover, the build-up to the next Bitcoin halving in 2028 could evoke excitement in traders. However, that excitement has not been reciprocated in ANT. As such, we could expect ANT to trade just below its 2026 value at around $13.4 by the end of 2027.
Aragon (ANT) Price Prediction 2028
As the crypto community’s hope will be re-ignited looking forward to Bitcoin halving like many altcoins, ANT may reciprocate its past behavior during the BTC halving. Hence, ANT would be trading at $17 after experiencing a considerable surge by the end of 2028.
Aragon (ANT) Price Prediction 2029
2029 is expected to be another bull run due to the aftermath of the BTC halving. However, traders speculate that the crypto market would gradually become stable by this year. In tandem with the stable market sentiment, ANT could be trading at $28.75 by the end of 2029.
Aragon (ANT) Price Prediction 2030
After witnessing a bullish run in the market, ANT and many altcoins would show signs of consolidation and might trade sideways and move downwards for some time while experiencing minor spikes. Therefore, by the end of 2030, ANT could be trading at $24.3
Aragon (ANT) Price Prediction 2040
The long-term forecast for ANT indicates that this altcoin could reach a new all-time high(ATH). This would be one of the key moments as HODLERS may expect to sell some of their tokens at the ATH point.
If they start selling then ANT could fall in value. It is expected that the average price of ANT could reach $44 by 2040.
Aragon (ANT) Price Prediction 2050
The community believes that there will be widespread adoption of cryptocurrencies, which could maintain gradual bullish gains. By the end of 2050, if the bullish momentum is maintained, it could hit $65
Conclusion
If investors continue showing their interest in ANT and add these tokens to their portfolio, it could continue to rise. ANT’s bullish price prediction shows that it could reach the $8.7 level.
FAQ
Aragon is a DAO framework that builds tools for creating, managing, and scaling tools for everyone to experiment with governance at the speed of software
ANT tokens can be traded on many exchanges like Binance, OKX, Bitrue, Bybit, and WEEX.
ANT has a possibility of surpassing its present all-time high (ATH) price of $14.79 in 2021.
ANT is one of the few cryptocurrencies that has gained value in the past seven days. If ANT continues this streak, it may reach $8.7.
ANT has been one of the most suitable investments in the crypto space. It is highly volatile, as such, it has quite a margin when its price fluctuates. Hence, traders may be allured to invest in ANT. It’s a good investment in the short term and in the long term as well.
The present all-time low price of ANT is $0.2858.
The maximum supply of ANT is 43,166,685 ANT.
ANT can be stored in a cold wallet, hot wallet, or exchange wallet.
ANT is expected to reach $8.7 by 2023.
ANT is expected to reach $14.4 by 2024.
ANT is expected to reach $19.6 by 2025.
ANT is expected to reach $9.6 by 2026.
ANT is expected to reach $13.44 by 2027.
ANT is expected to reach $17 by 2028.
ANT is expected to reach $28.75 by 2029.
ANT is expected to reach $24.3 by 2030.
ANT is expected to reach $44 by 2040.
ANT is expected to reach $65 by 2050.
Disclaimer: The views and opinions, as well as all the information shared in this price prediction, are published in good faith. Readers must do their research and due diligence. Any action taken by the reader is strictly at their own risk. Coin Edition and its affiliates will not be held liable for any direct or indirect damage or loss.
More Crypto Price Predictions:
- Verge (XVG) Price Prediction 2023-2030
- Optimism (OP) Price Prediction 2023-2030
- Worldcoin (WLD) Price Prediction 2023-2030
- Alien Worlds (TLM) Price Prediction 2023-2030
- SingularityNET (AGIX) Price Prediction 2023-2030
Disclaimer: The information presented in this article is for informational and educational purposes only. The article does not constitute financial advice or advice of any kind. Coin Edition is not responsible for any losses incurred as a result of the utilization of content, products, or services mentioned. Readers are advised to exercise caution before taking any action related to the company.
 Price Prediction 2026, 2027, 2028, 2029, 2030 -2050")


