


 Price Prediction 2023-2030: Will TLM Price Hit $0.03 Soon?")
- Bullish TLM price prediction ranges from $0.00968 to $0.0393.
- Analysis suggests that the TLM price might reach above $0.2369.
- The TLM bearish market price prediction for 2023 is $0.01026.
What is Alien Worlds (TLM)?
Alien Worlds built by its community is a decentralized, non-fungible token (NFT) metaverse where players compete for scarce resources, Trilium (TLM), in a stimulated economy centered around planetary worlds. In order to supplement the above structure, Alien Worlds also has a decentralized finance (DeFi) element to the game where players advance by staking TLM and using TLM to vote in Planet Decentralized Autonomous Organizations (DAOs).
Players, called “explorers” can earn monetary rewards through gameplay or participation in Planet DAOs. By mining in Alien Worlds, a user is rewarded with the native, in-game currency — Trilium (TLM) or NFT packs. Players can stake TLM to boost their rewards or battle with other users for NFTs.
Every TLM coin holder has a stake in deciding who runs the platform, this allows people to use TLM to stake, vote, or even become a leader.
Players can stake their TLM to Planet DAOs, which then shows their alliance to a planet and allows them to receive more daily TLM rewards. Based on the amount of TLM staked, affects the extent to which a user can vote for the future of the planet.
Becoming a leader in Alien Worlds is no foreign feat, as the platform allows players to run for candidacy to be a Councillor in more than one planet. Each planet can be managed by more than one elected Councillor, who will share multi-sig control over the respective Planet DAO account.
Table of contents
- What is Alien Worlds (TLM)?
- Alien Worlds (TLM) Market Overview
- Analyst’s View on Alien Worlds (TLM)
- Alien Worlds (TLM) Current Market Status
- Alien Worlds (TLM) Price Analysis 2023
- Alien Worlds (TLM) Price Prediction 2023-2030 Overview
- Alien Worlds (TLM) Price Prediction 2023
- Alien Worlds (TLM) Price Prediction 2024
- Alien Worlds (TLM) Price Prediction 2025
- Alien Worlds (TLM) Price Prediction 2026
- Alien Worlds (TLM) Price Prediction 2027
- Alien Worlds (TLM) Price Prediction 2028
- Alien Worlds (TLM) Price Prediction 2029
- Alien Worlds (TLM) Price Prediction 2030
- Alien Worlds (TLM) Price Prediction 2040
- Alien Worlds (TLM) Price Prediction 2050
- Conclusion
- FAQ
- More Crypto Price Predictions:
Alien Worlds (TLM) Market Overview
HTTP Request Failed... Error: file_get_contents(https://pro-api.coinmarketcap.com/v2/cryptocurrency/quotes/latest?slug=alien-worlds): Failed to open stream: HTTP request failed! HTTP/1.1 429 Too Many Requests
Analyst’s View on Alien Worlds (TLM)
ChainPlay.GG a blockchain gaming hub requested its followers to explore the Aliens world and unlock the secrets of an immersive Web3Gaming experience.
Alien Worlds (TLM) Current Market Status
TLM has a circulating supply of 3,596,589,814 TLM coins, while its maximum supply is 10,000,000,000 TLM coins, according to CoinMarketCap. At the time of writing, TLM is trading at $0.0115 representing 24 hours decrease of 2.57%. The trading volume of TLM in the past 24 hours is $5,391,941 which represents an 8.81% decrease.
Some top cryptocurrency exchanges for trading TLM are Binance, Bitrue, Bybit, Bitget, and Hotcoin Global.
Now that you know TLM and its current market status, we shall discuss the price analysis of TLM for 2023.
Alien Worlds (TLM) Price Analysis 2023
Currently, Alien Worlds (TLM) ranks 393 on CoinMarketCap. Will TLM’s most recent improvements, additions, and modifications help its price go up? First, let’s focus on the charts in this article’s TLM price forecast.
Alien Worlds (TLM) Price Analysis – Bollinger Bands
The Bollinger bands are a type of price envelope developed by John Bollinger. It gives a range with an upper and lower limit for the price to fluctuate. The Bollinger bands work on the principle of standard deviation and period (time).
The upper band as shown in the chart is calculated by adding two times the standard deviation to the Simple Moving Average while the lower band is calculated by subtracting two times the standard deviation from the Simple Moving Average. When the bands widen, it shows there’s going to be more volatility and when they contract, there is less volatility.
When Bollinger bands are used in a cryptocurrency chart, we could expect the price of the cryptocurrency to reside within the upper and lower bounds of the Bollinger bands 95% of the time. The above thesis is derived from an Empirical law.
The sections highlighted by red rectangles in the chart above show how the bands expand and contract. When the bands widen, we could expect more volatility, and when the bands contract, it denotes less volatility. The green rectangle show how STX retraced after touching the upper band (overbought).
When considering the chart above, it could be noted that the Bollinger bands have taken the same shape as it took back in November 2022. Moreover, the Bollinger bandwidth (BBW) indicator also gave a reading of 0.71 on both of these occasions. However, as the BBW indicator is moving downwards we may see the Bollinger bands shrink in the future.
As such, we could expect a period of consolidation where TLM moves sideways. After moving sideways, there may be a period of more volatility, which may see TLM spike. If TLM reciprocates its behavior during the beginning of 2023, then it may rise touching the upper Bollinger band.
Alien Worlds (TLM) Price Analysis – Relative Strength Index
The Relative Strength Index is an indicator that is used to find out whether the price of a security is overvalued or undervalued. As per its name, RSI indicators help determine how the security is doing at present, relative to its previous price.
Moreover, it has a signal line which is a Simple Moving Average (SMA) that acts as a yardstick or reference to the RSI line. Hence, whenever the RSI line is above the SMA, it is considered bullish; if it’s below the SMA, it is bearish.
Currently, the RSI gives a reading of 40.7 and it is above the signal. As the RSI is neither overbought nor oversold, it could be said that the trend is strong. However, as the RSI is positioned parallel to the horizontal axis, TLM may consolidate in the future.
According to the RSI Support and Resistance by DGT indicator, TLM has risen above the Crossover Oversold region (blue line).TLM has recovered below the Crossunder Oversold region.
Now that TLM is just under the bear zone (dark red line), it may cross the bear zone. Should TLM cross the bear zone at $0.01175, then it could rise to the bear zone. Traders may want to consider entering the market once TLM crosses the bear zone.
However, as per the StochRSI indicator, TLM is overbought and might not reach the bull zone. Nonetheless, the StochRSI which gauges RSI value is notorious for giving out false signals as it moves fast within the range. As such, traders should take precautions.
Alien Worlds (TLM) Price Analysis – Moving Average
The Exponential Moving averages are quite similar to the simple moving averages (SMA). However, the SMA equally distributes down all values whereas the Exponential Moving Average gives more weightage to the current prices. Since SMA undermines the weightage of the present price, the EMA is used in price movements.
The 200-day MA is considered to be the long-term moving average while the 50-day MA is considered the short-term moving average in trading. Based on how these two lines behave, the strength of the cryptocurrency or the trend can be determined on average.
Whenever the price of cryptocurrency is above the 50-day and 200-day MA, we may say that the token is bullish. Contrastingly, if the token is below the 50-day and 200-day, or below both, then it is bearish ( triangle section). Since both the moving averages are heading downwards, it is safe to say that TLM is on a downtrend in the long and short term.
Currently, TLM is below both the moving averages and it is rising towards the 50-Day EMA exponentially. Once it reaches the 50-Day EMA, it could be obstructed by resistance. However, if it breaks above the 50-Day EMA, we may see it rising toward the 200-day EMA.
TLM seems to be reciprocating its behavior during the beginning of 2023 when considering how it has intersected the 20-day MA (white line). Moreover, when scrutinizing the candlestick, on both these occasions, TLM had a bullish inverted hammer. As such, there is a high possibility of TLM increasing in value and testing the 50-day.
However, the 100-day MA has crossed below the 200-day, which signifies that a death cross has happened. As such, the question is, will TLM be able to recover from the death cross and rise toward the 50-day MA?
Alien Worlds (TLM) Price Analysis – Elder Force Index
Elder Force Index is an indicator that was invented by Alexander Elder, who was an entrepreneur. The indicator mainly uses two parameters to adjudicate the buying and selling force and thereby predicts the market trend. In particular, it relies on price change and volume. As such the strength of the buying force or selling force is dependent on either the price change or the volume.
Whenever the EFI is greater than zero, or positive, we could say that the trend is bullish, as there is more buying pressure. However, when the EFI is in the negative zone, we could say that the cryptocurrency is in the negative zone and the selling pressure is more.
Moreover, the Elder Force could also be used to figure out trend reversals and breakouts. For instance when the EFI is making lower highs while the cryptocurrency is making higher highs, then we could say that this is a bearish divergence. However, in the event that the cryptocurrency is making lower lows while the EFI is making higher lows, then it is a bullish divergence represented in the chart.
Currently, the EFI is parallel to the horizontal axis and it is very close to the zero line, reading a value of -9.962K. It may cross into the positive zone any moment from now. This is a good sign for those trying to enter into a long position. However, when observing the historic behavior of TLM EFI, it has the tendency to go close to the zero line and without crossing, it starts to reduce. This may be another feint move, as such, traders may need to do their due diligence.
Additionally, the Bear Bull Power (BBP) indicator read a value of 0.00040. After changing its direction the BBP indicator seems to be moving downwards. This also justifies the above statement where TLM may be feint moving. However, the volume which indicates 26.734M seems to have increased by quite a margin. There could be a price correction before buyers join the bandwagon and take TLM higher.
Alien Worlds (TLM) Price Prediction 2023-2030 Overview
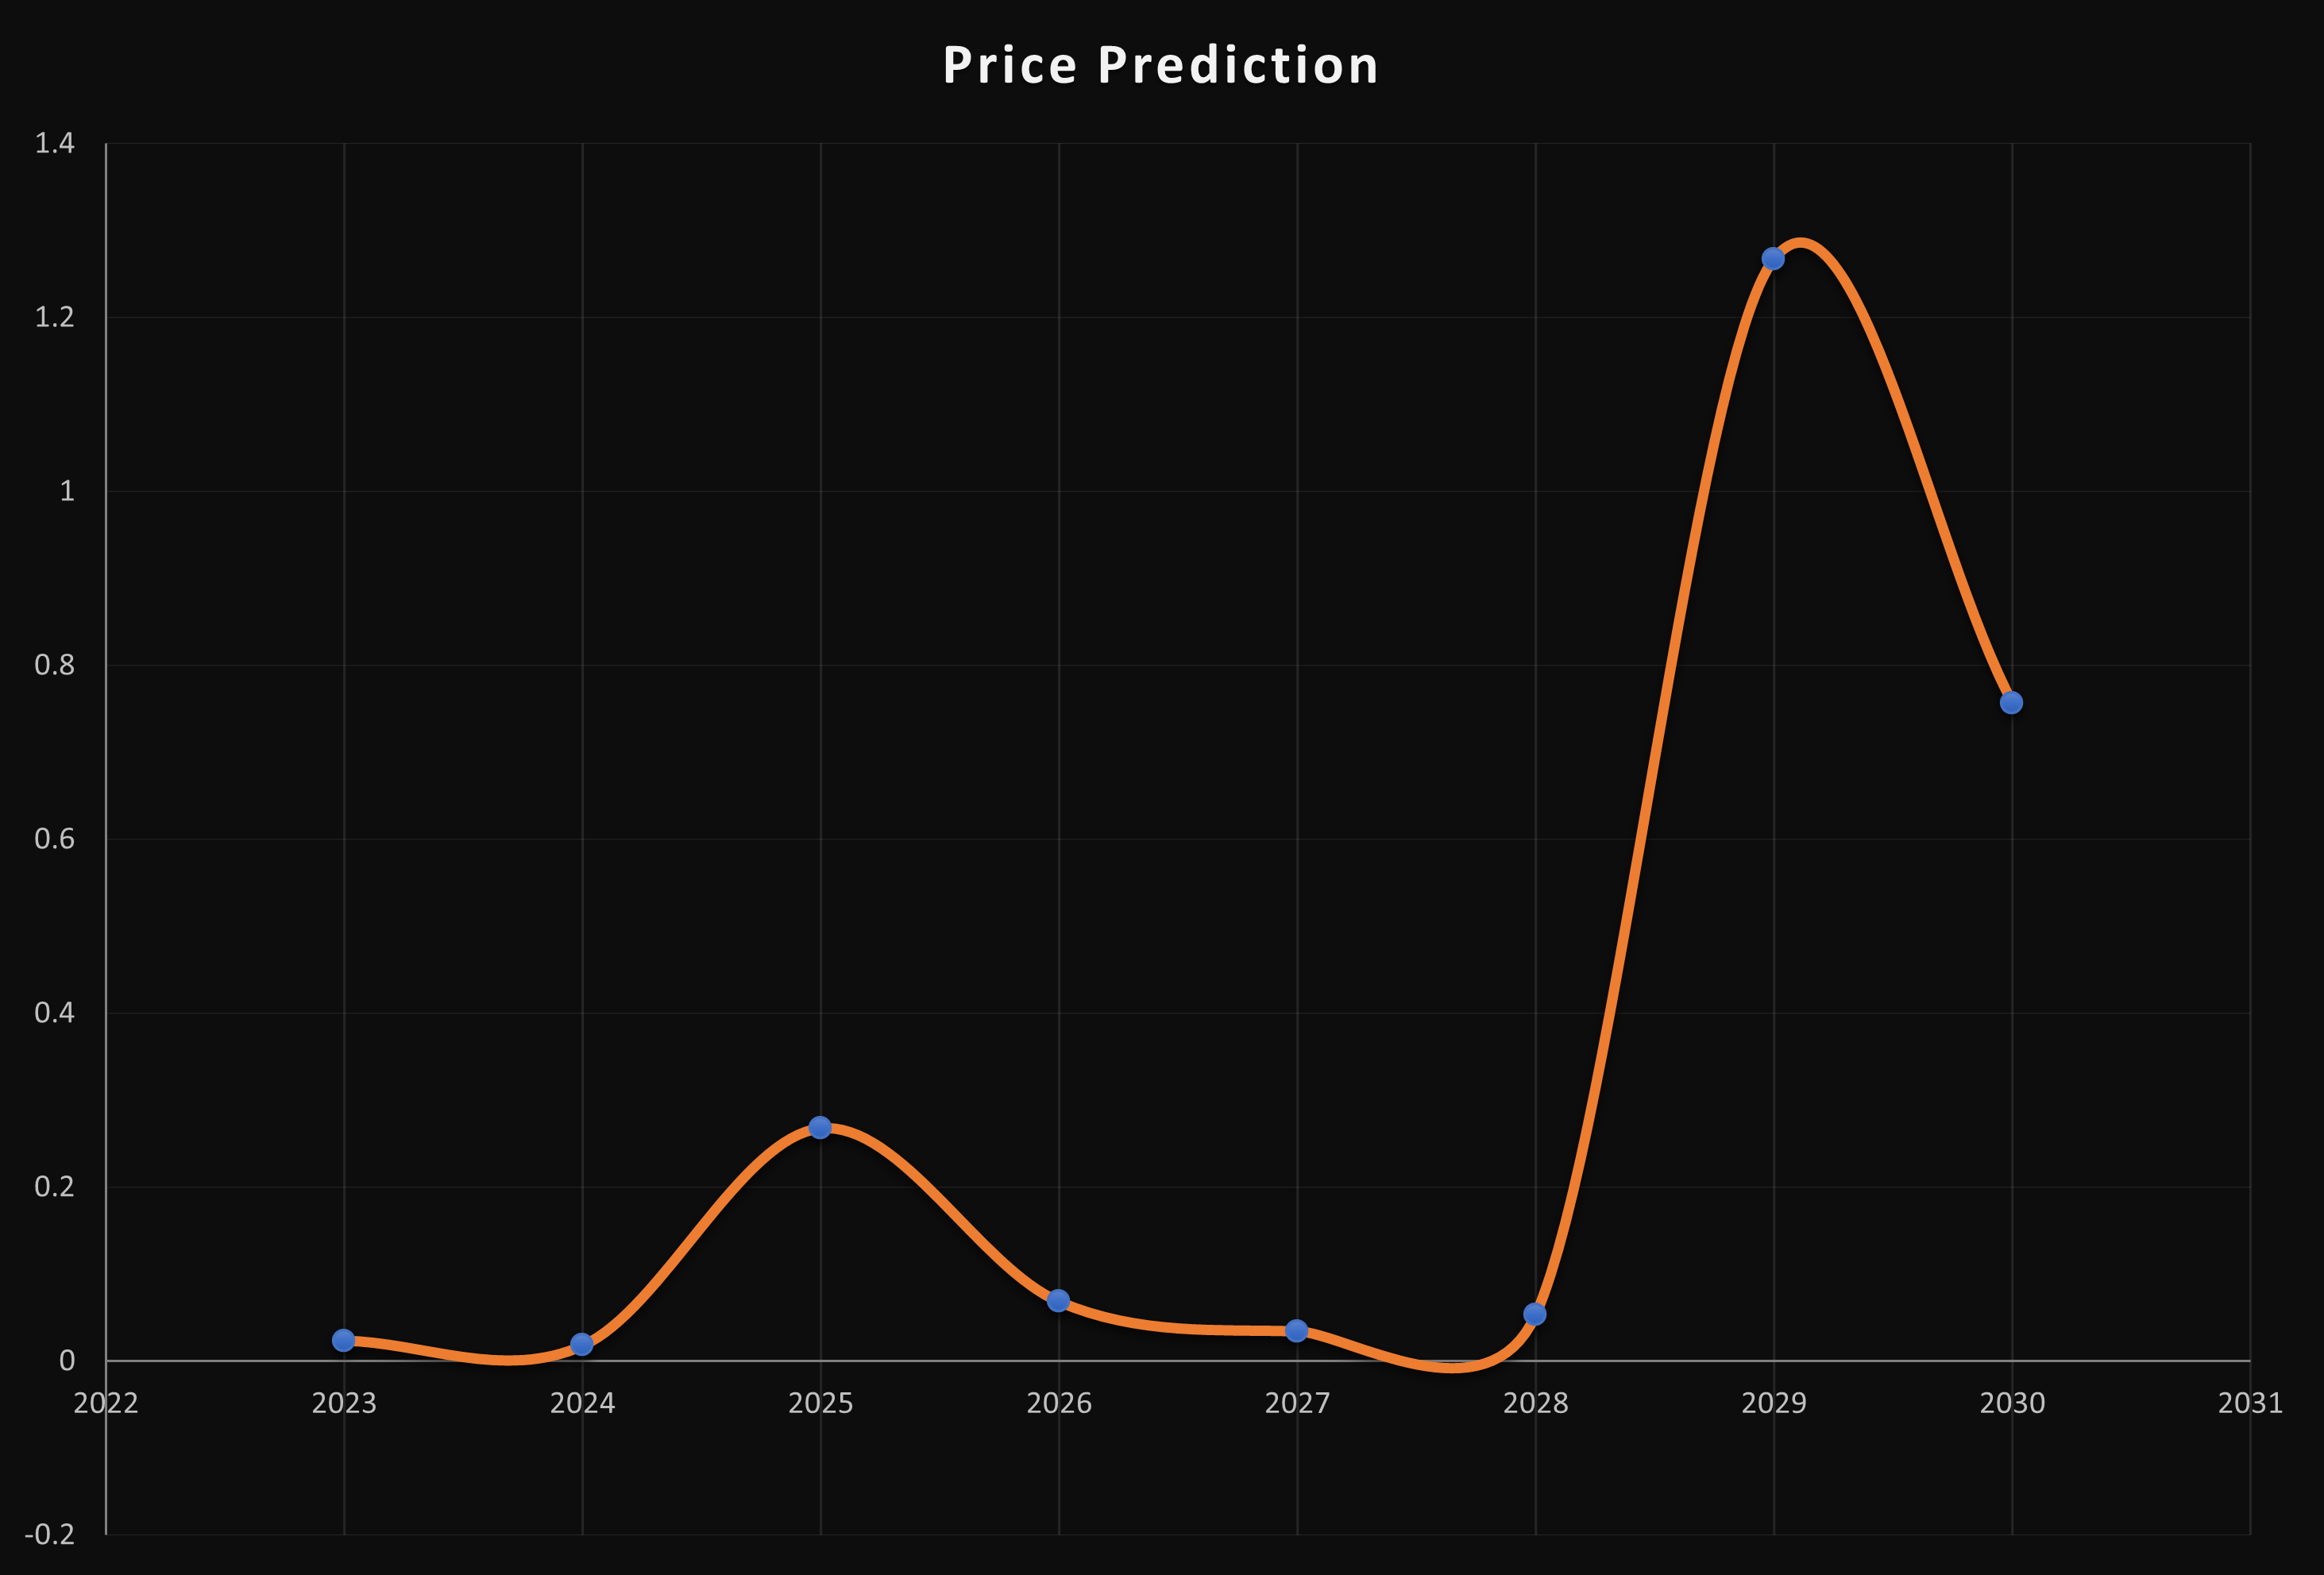
| Year | Minimum Price | Average Price | Maximum Price |
| 2023 | $0.02215 | $0.02369 | $0.02400 |
| 2024 | $0.01758 | $0.01792 | $0.01850 |
| 2025 | $0.2450 | $0.26773 | $0.2750 |
| 2026 | $0.06112 | $0.06843 | $0.07125 |
| 2027 | $0.02915 | $0.03443 | $0.03625 |
| 2028 | $0.04912 | $0.05363 | $0.05991 |
| 2029 | $1.052 | $1.2669 | $1.312 |
| 2030 | $0.6915 | $0.7572 | $0.8124 |
| 2040 | $2.1030 | $2.3031 | $2.451 |
| 2050 | $3.6170 | $3.8708 | $4.250 |
Alien Worlds (TLM) Price Prediction 2023
When considering the above chart, it could be noted that TLM is trading inside a falling wedge since February. It has been making lower highs and lower lows trapped inside the wedge. Since TLM is rising toward the upper trend line of the falling wedge, it may hit the upper trend line and change direction and continue to remain in the wedge.
Although, it is a common practice to enter the market when TLM breaks the wedge, however, it is wise to let the market saturate before going long. This is because TLM made a feint breakout off of the wedge on a previous occasion.
However, in the event that TLM reciprocates its early 2023 behavior, it may rise exponentially above Resistance 2 ($0.02369) breaking Resistance 1 ($0.01603) and more importantly breaking the wedge. However, a premature breakage seems to not exist as per the bear bull power indicator.
However, those optimistic buyers looking for a premature breakout may want to consider entering the market, after confirming that it is not a feint breakout. As per the best practice of trading the falling wedge, they may enter the market at the sight of the breakout and the confirmation of a non-bogus one. They may have their take profit close to $0.02050 while their stop-loss could be at the lower trend line.
However, those with the idealogy of TLM breaking out of the wedge once it’s completed forming it may need to bide their time. More importantly, TLM is at its lowest, which means there lies no support for it below this level, except for the lower trend line and maybe the lower Bollinger band.
Alien Worlds (TLM) Price Prediction – Resistance and Support Levels
When considering the chart above, it could be noted that TLM plummeted from Resistance 3 along the 1:8, 1:4, and 1:3 Gann line before it continued its fall just below the 1:1 Gann line.
However, the TLM’s fate changed with the dawn of the new year 2023, where it rose along the 4:1 Gann line.
But come May TLM faced a horrific fall reaching for support at the 8:1 Gann line which offered help for a brief period before TLM fell further. Currently, TLM is just below the 2:1 Gann line and it may break above it or at least fall along that.
Alien Worlds (TLM) Price Prediction 2024
There will be Bitcoin halving in 2024, and hence we should expect a positive trend in the market due to user sentiments and the quest by investors to accumulate more of the coin. However, the year of BTC halving didn’t yield the maximum TLM based on the previous halving. Hence, we could expect TLM to trade at a price not below $0.01792 by the end of 2024.
Alien Worlds (TLM) Price Prediction 2025
TLM may experience the after-effects of the Bitcoin halving and is expected to trade much higher than its 2024 price. Many trade analysts speculate that BTC halving could create a huge impact on the crypto market. Moreover, similar to many altcoins, TLM will continue to rise in 2025 forming new resistance levels. It is expected that TLM would trade beyond the $0.26773 level.
Alien Worlds (TLM) Price Prediction 2026
It is expected that after a long period of bull run, the bears would come into power and start negatively impacting the cryptocurrencies. During this bearish sentiment, TLM could tumble into its support regions. During this period of price correction, TLM could lose momentum and be way below its 2025 price. As such it could be trading at $0.06843 by 2026.
Alien Worlds (TLM) Price Prediction 2027
Naturally, traders expect a bullish market sentiment after the crypto industry was affected negatively by the bears’ claw. Moreover, the build-up to the next Bitcoin halving in 2028 could evoke excitement in traders. However, that excitement has not been reciprocated in TLM. As such, we could expect TLM to trade just below its 2026 value at around $0.03443 by the end of 2027.
Alien Worlds (TLM) Price Prediction 2028
As the crypto community’s hope will be re-ignited looking forward to Bitcoin halving like many altcoins, TLM may reciprocate its past behavior during the BTC halving. Hence, TLM would be trading at $0.05363 after experiencing a considerable surge by the end of 2028.
Alien Worlds (TLM) Price Prediction 2029
2029 is expected to be another bull run due to the aftermath of the BTC halving. However, traders speculate that the crypto market would gradually become stable by this year. In tandem with the stable market sentiment, TLM could be trading at $1.26697 by the end of 2029.
Alien Worlds (TLM) Price Prediction 2030
After witnessing a bullish run in the market, TLM and many altcoins would show signs of consolidation and might trade sideways and move downwards for some time while experiencing minor spikes. Therefore, by the end of 2030, TLM could be trading at $0.7572
Alien Worlds (TLM) Price Prediction 2040
The long-term forecast for TLM indicates that this altcoin could reach a new all-time high(ATH). This would be one of the key moments as HODLERS may expect to sell some of their tokens at the ATH point.
If they start selling then TLM could fall in value. It is expected that the average price of TLM could reach $2.3031 by 2040.
Alien Worlds (TLM) Price Prediction 2050
The community believes that there will be widespread adoption of cryptocurrencies, which could maintain gradual bullish gains. By the end of 2050, if the bullish momentum is maintained, TLM could hit $3.8708
Conclusion
If investors continue showing their interest in TLM and add these tokens to their portfolio, it could continue to rise. TLM’s bullish price prediction shows that it could reach $0.025 level.
FAQ
Alien Worlds built by its community is a decentralized, non-fungible token (NFT) metaverse where players compete for scarce resources, Trilium (TLM), in a stimulated economy centered around planetary worlds
TLM tokens can be traded on many exchanges like Binance, Bitrue, Bybit, Bitget, and Hotcoin Global.
TLM has a possibility of surpassing its present all-time high (ATH) price of $7.1885 in 2021.
TLM is one of the few cryptocurrencies that has shown resilience. If TLM breaks out of its falling wedge, it might reach $0.03 soon after it breaks the Resistance 1 and 2 levels.
TLM has been one of the most suitable investments in the crypto space. It is highly volatile, as such, it has quite a margin when its price fluctuates. Hence, traders may be allured to invest in TLM. It’s a good investment in the short term and in the long term as well.
The present all-time low price of TLM is $0.009574.
The maximum supply of TLM is 10,000,000,000 TLM coins.
TLMcan be stored in a cold wallet, hot wallet, or exchange wallet.
TLM is expected to reach $0.025 by 2023.
TLM is expected to reach $0.01792 by 2024.
TLM is expected to reach $0.26773 by 2025.
TLM is expected to reach $0.06843 by 2026.
TLM is expected to reach $0.03443 by 2027.
TLM is expected to reach $0.05363 by 2028.
TLM is expected to reach $1.2669 by in 2029.
TLM is expected to reach $0.7572 by 2030.
TLM is expected to reach $2.3031 by 2040.
TLM is expected to reach $3.8708 by 2050.
Disclaimer: The views and opinions, as well as all the information shared in this price prediction, are published in good faith. Readers must do their research and due diligence. Any action taken by the reader is strictly at their own risk. Coin Edition and its affiliates will not be held liable for any direct or indirect damage or loss.
More Crypto Price Predictions:
- Verge (XVG) Price Prediction 2023-2030
- Aragon (ANT) Price Prediction 2023-2030
- Optimism (OP) Price Prediction 2023-2030
- Worldcoin (WLD) Price Prediction 2023-2030
- SingularityNET (AGIX) Price Prediction 2023-2030
Disclaimer: The information presented in this article is for informational and educational purposes only. The article does not constitute financial advice or advice of any kind. Coin Edition is not responsible for any losses incurred as a result of the utilization of content, products, or services mentioned. Readers are advised to exercise caution before taking any action related to the company.


