
- ARB faces a bearish pressure potential drop to the $1.10 support level.
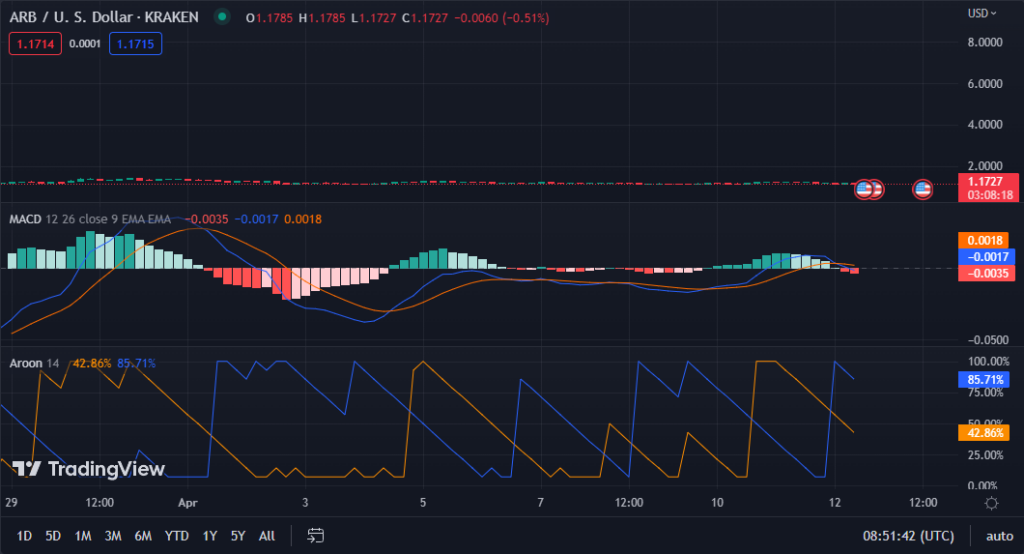
- MACD bearish crossing signals a short-term selling opportunity.
- Bearish momentum dominates the market; caution is advised for long-term holders.
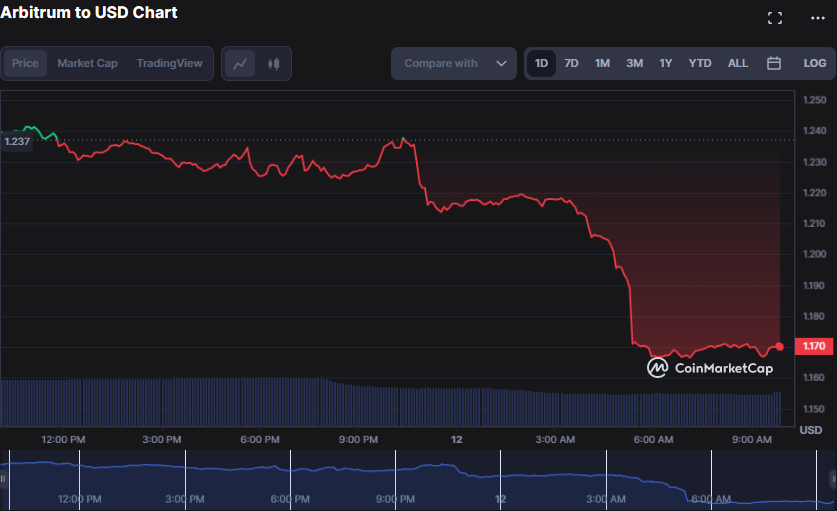
After a bullish start that propelled the Arbitrum (ARB) price to a 24-hour high of $1.24, the bears grabbed control and pulled the price down to $1.17 within a few hours, a 5.33% fall as of press time. If the bears break this support level, the price of ARB may fall further, perhaps hitting the next support level at $1.10.
However, if the bulls take control and push the price over $1.24, it might indicate a possible upward trend for ARB. This recession led the market capitalization and 24-hour trading volume to retrace by 5.24% and 24.10%, respectively, to $1,495,666,675 and $343,751,177.
This drop shows that investors are becoming more cautious and may wait for the market to settle before making any substantial movements. However, this might be a chance for long-term investors to join the market at a cheaper price point and perhaps reap more significant benefits in the future.
On the ARBUSD 4-hour price chart, the MACD blue line has recently moved below its signal line, with a value of -0.0017. This movement, a bearish crossing, indicates that the short-term trend of ARB/USD is now negative, signalling a possible selling opportunity for traders. Since it is in negative territory, traders may consider setting stop-loss orders to minimize potential losses if the price continues to drop.
The MACD histogram swings into negative territory with a value of -0.0035, adding to the bearish mood. This trajectory suggests that the downturn may continue in the short term since selling pressure is intense and momentum remains adverse.
In light of the 85.71% Aroon down reading and the 42.86% Aroon up reading on the ARB price chart, investors should be wary of holding long positions for the foreseeable future. This move urges traders to wait to confirm a trend reversal before establishing new positions since the Aroon indicator suggests a strong downtrend in the market, and there is a possibility of further price decline soon.
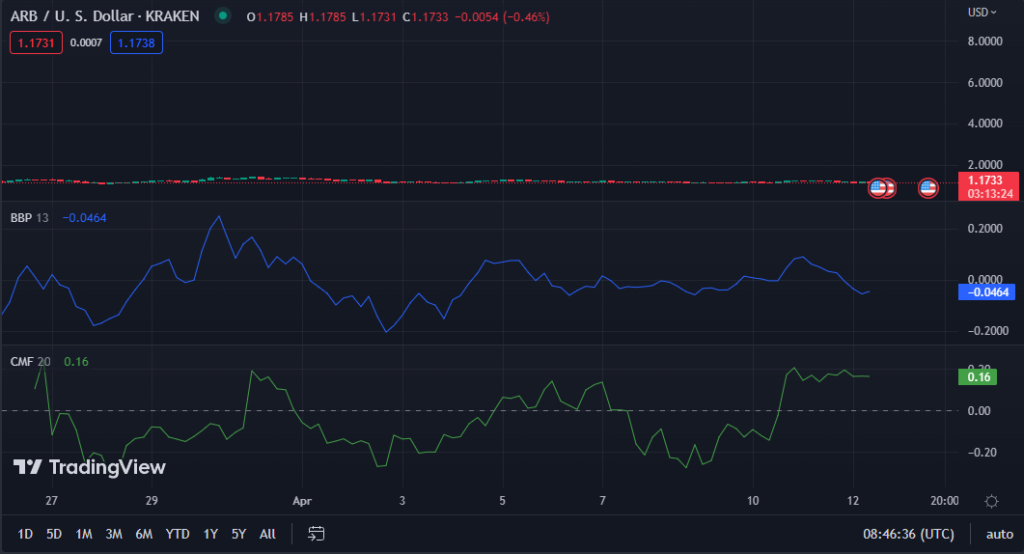
The ARB/USD price chart’s Bull Bear Power score of -0.0449 suggests that the bears now rule the market, with selling pressure outweighing purchasing demand. This BBP rating and its downward trend signal that traders in the ARB/USD market may wish to consider short positions or wait for a possible price turnaround before establishing long positions.
The ARB’s negative momentum is modest, with a Chaikin Money Flow score of 0.16, suggesting a possible buying opportunity. This expectation of a buying opportunity stems from the CMF level being above zero, indicating that there is still purchasing pressure in the market despite the negative momentum, which might lead to a price gain.
As ARB faces bearish pressure, cautious investors may wait for a trend reversal, while opportunistic ones can seize the chance to buy low.
Disclaimer: The views, opinions, and information shared in this price prediction are published in good faith. Readers must do their research and due diligence. Any action taken by the reader is strictly at their own risk. Coin Edition and its affiliates will not be liable for direct or indirect damage or loss.
Disclaimer: The information presented in this article is for informational and educational purposes only. The article does not constitute financial advice or advice of any kind. Coin Edition is not responsible for any losses incurred as a result of the utilization of content, products, or services mentioned. Readers are advised to exercise caution before taking any action related to the company.


