


- Recent research predicts a lengthy bull run in the foreseeable future.
- Bullish momentum drives ATOM to a new 30-day high of $15.12.
- Bulls must exert pressure to drive ATOM prices to new heights.
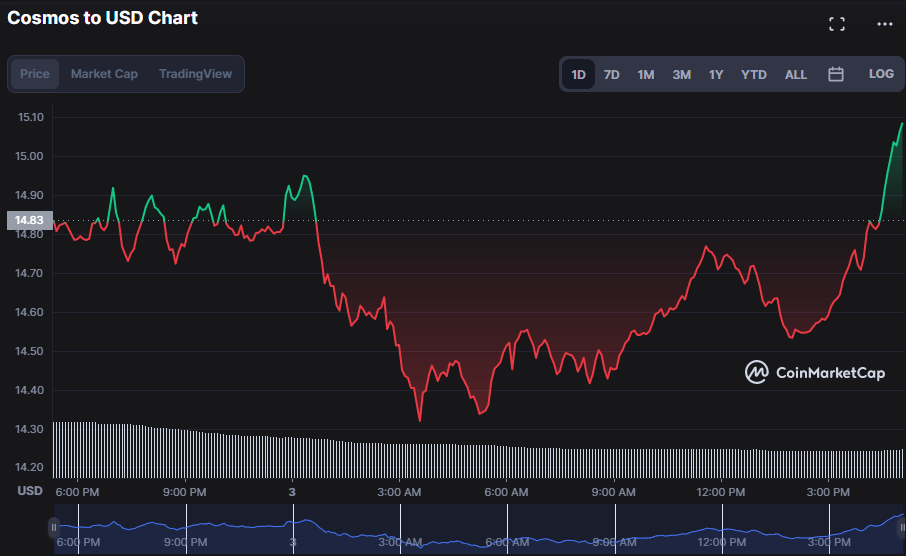
The Cosmos (ATOM) market has suffered a correction in recent hours, with the price increasing by 1.62% to $15.05 as of press time. This bullish dominance propelled ATOM to a 30-day high of $15.12 after hitting support of around $14.31.
The market capitalization increased by 1.61% to $4,308,719,475 due to the bullish run; however, the 24-hour trading volume decreased by 49.58% to $253,741,041. The present gain is linked to investors’ positive feelings and increased demand for ATOM tokens. However, since the 24-hour trade volume is declining, it is still being determined if the bullish trend will continue for an extended period.
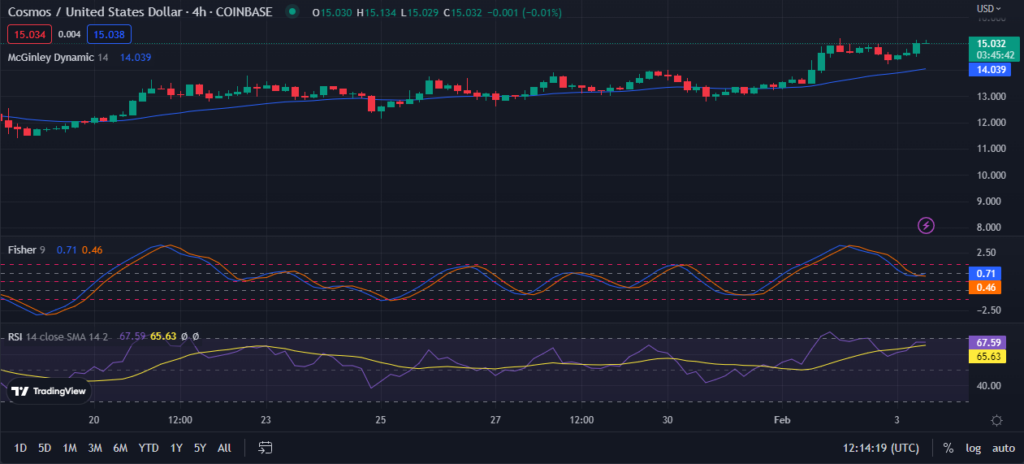
The McGinley dynamic indicator line on the ATOM 4-hour price chart progresses north with a value of 14.040, indicating that buyers have the upper hand in price action and that the optimistic attitude will continue.
The Fisher Transform trended above its signal line with a value of 0.71, confirming the positive momentum on the ATOM chart. Furthermore, the Relative Strength Index (RSI) is now at 67.69, just below the overbought level of 70.
This suggests that the market may still have some potential to rise higher before it is declared overbought. This movement indicates that the positive trend is likely to continue in the short term since the market is approaching overbought levels fast.
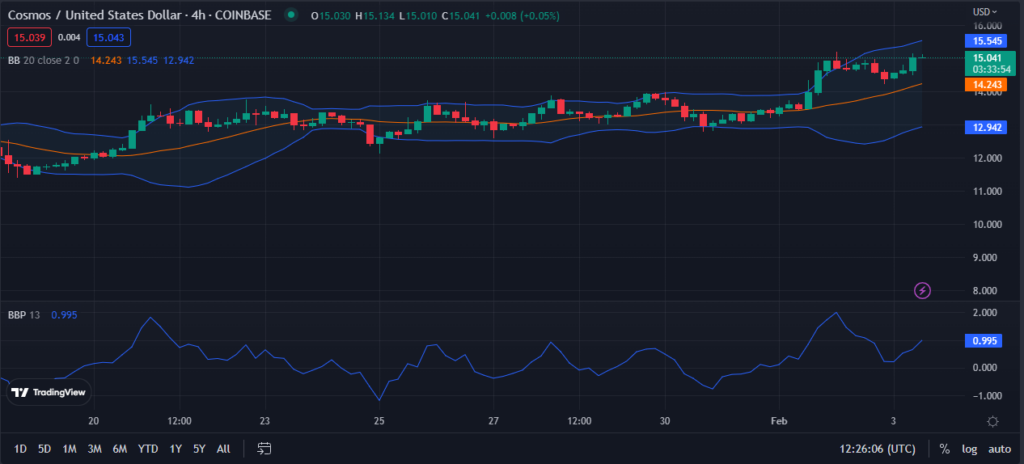
The Bollinger bands are broadening with the upper band at $15.541 and the lower band at $12.944, showing more volatility in the ATOM market. As the price moves closer to the top range, a break over $15.541 will signal a significant escalation in volatility and certainly a continuation of the upward trend. ATOM traders should be ready for more volatile market conditions in light of this potential price breakthrough.
BBP’s positive trend of 0.988 indicates that buyers have regained market control, suggesting that ATOM’s price will soon make a significant upward breakout. In addition, the fact that it is trending north shows that there are many bulls in the market and that the price may soon break above the $15.541 resistance level.
The Cosmos bulls need to break and remain above the current level of resistance to maintain dominance.
Disclaimer: The views and opinions, as well as all the information shared in this price analysis, are published in good faith. Readers must do their own research and due diligence. Any action taken by the reader is strictly at their own risk. Coin Edition and its affiliates will not be held liable for any direct or indirect damage or loss.
Disclaimer: The information presented in this article is for informational and educational purposes only. The article does not constitute financial advice or advice of any kind. Coin Edition is not responsible for any losses incurred as a result of the utilization of content, products, or services mentioned. Readers are advised to exercise caution before taking any action related to the company.


