



- BEAM faces resistance at $0.0052, while a breakout could push prices toward $0.0057 and $0.0063.
- Open interest surged to $16.58 million, raising liquidation risks and potentially amplifying volatility.
- Net exchange outflows reached $50,070, suggesting reduced selling supply if withdrawals persist.
Beam (BEAM) faces renewed selling pressure after a strong weekly rally pushed its price toward $0.0063. The token traded around $0.005035 on November 2, recording a 13.19% decline over 24 hours. However, BEAM still maintains a 58.90% gain over the past seven days. Its daily trading volume reached $131.63 million, while its market capitalization stood at approximately $252 million.
BEAM Rally Loses Momentum as Sellers Target Key Support
BEAM’s latest decline follows an impressive recovery from its August low of $0.001273. The token established successive higher highs and higher lows before approaching $0.0063. However, sellers recently challenged that upward momentum, pushing the price below $0.0052.
The $0.0052 region now represents an important resistance level. This area aligns with the 0.786 Fibonacci retracement, making it a significant recovery barrier. Consequently, buyers need to reclaim this level before attempting another move higher.
A successful breakout could expose $0.0057 as the next upside target. Beyond that level, BEAM could revisit its recent peak around $0.0063. Such a move would suggest that buyers have regained control following the correction.
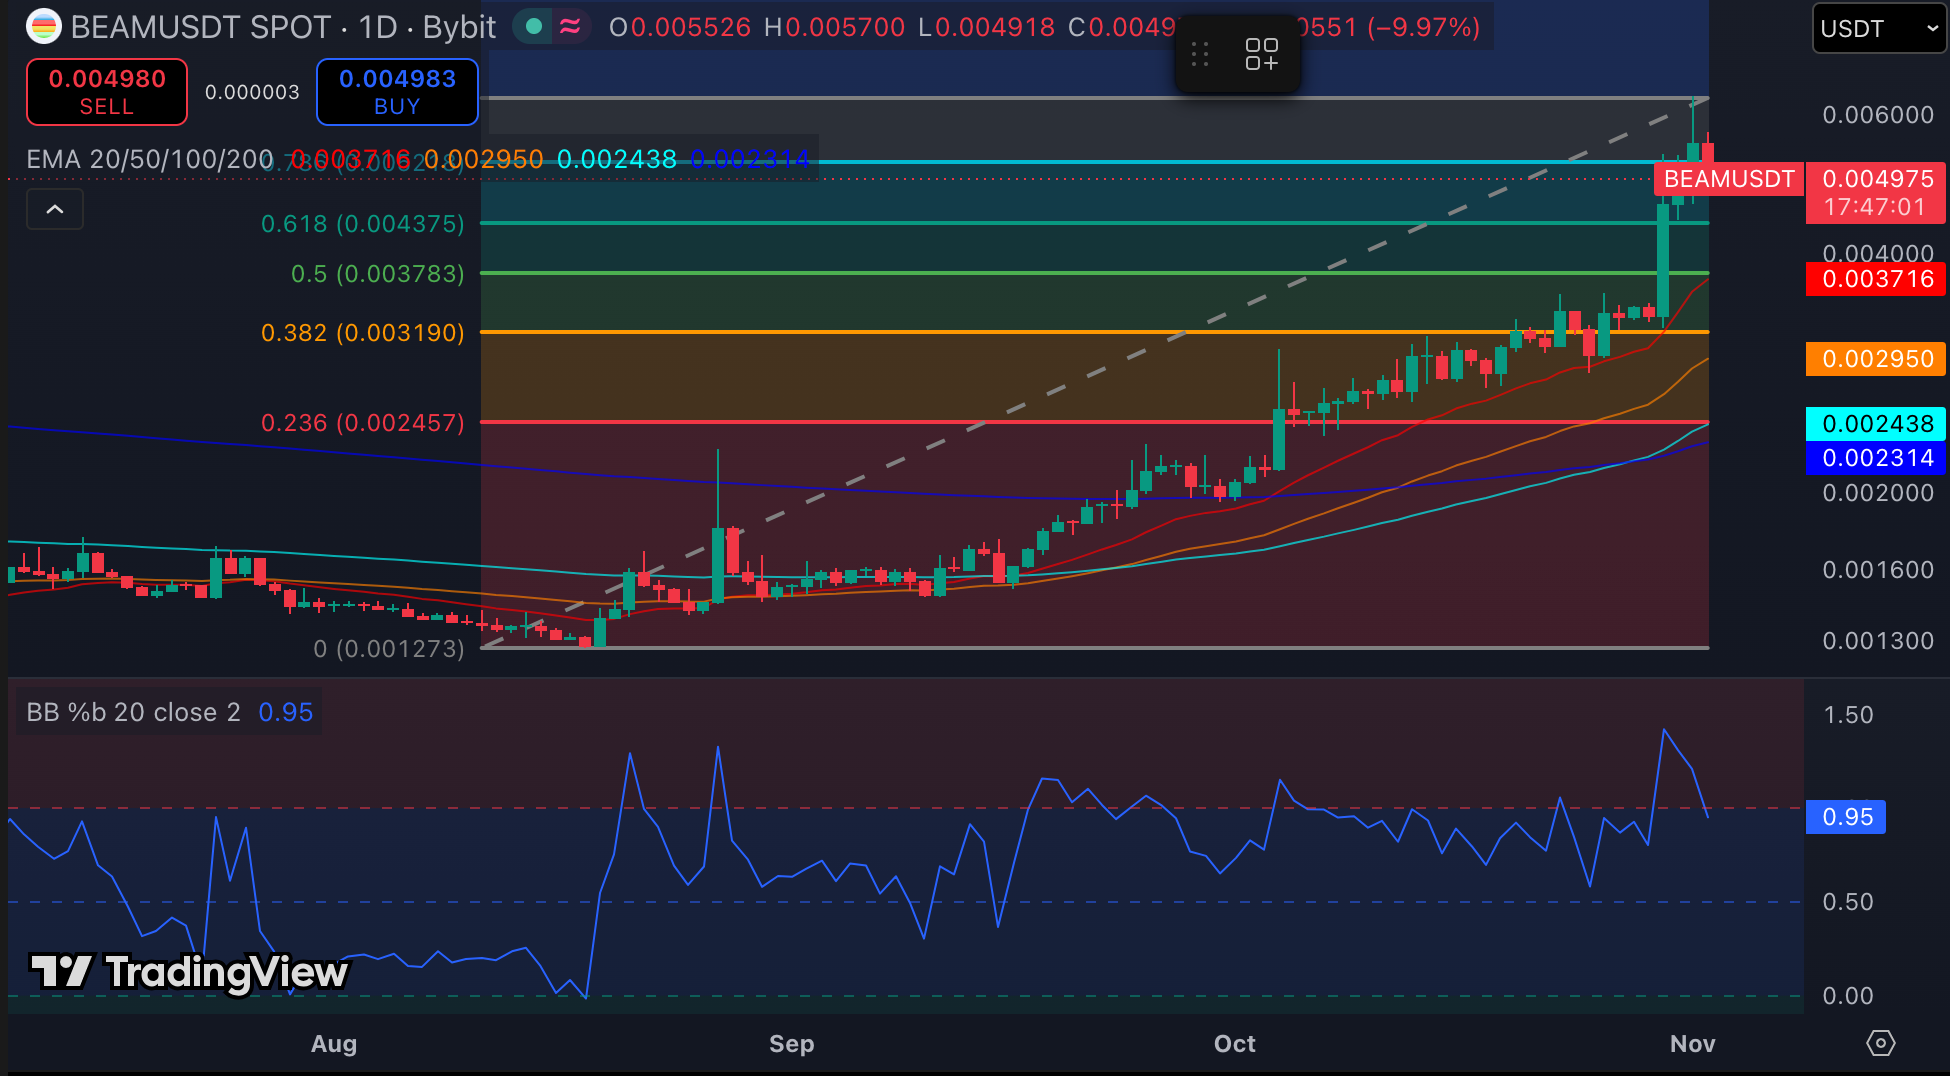
However, continued selling could bring $0.004375 into focus. This level represents the 0.618 Fibonacci retracement and offers the first major support. A breakdown could expose the $0.00378-0.00372 region.
That area combines the 0.5 Fibonacci level with the 20-day EMA. Besides, the daily chart shows BEAM trading above its 20-, 50-, 100-, and 200-day EMAs. Their bullish arrangement suggests that the broader recovery remains intact.
Related: Bitcoin Price Prediction November 2026: Can BTC Reclaim $80,225 as ETF Flows Turn Negative?
The Bollinger %B indicator has also retreated to 0.95 after previously exceeding 1. This movement indicates that BEAM has returned inside its upper Bollinger Band. Nevertheless, it does not independently confirm a bearish reversal.
Open Interest Surge Signals Growing Market Exposure
BEAM’s derivatives market has experienced a significant increase in trading activity. Open interest climbed to $16.58 million as the token approached $0.0055. This represents a substantial increase from its previous $3 million–$4 million range.
Moreover, the latest reading brings open interest closer to its October 2025 peak. That previous high stood near $25 million.
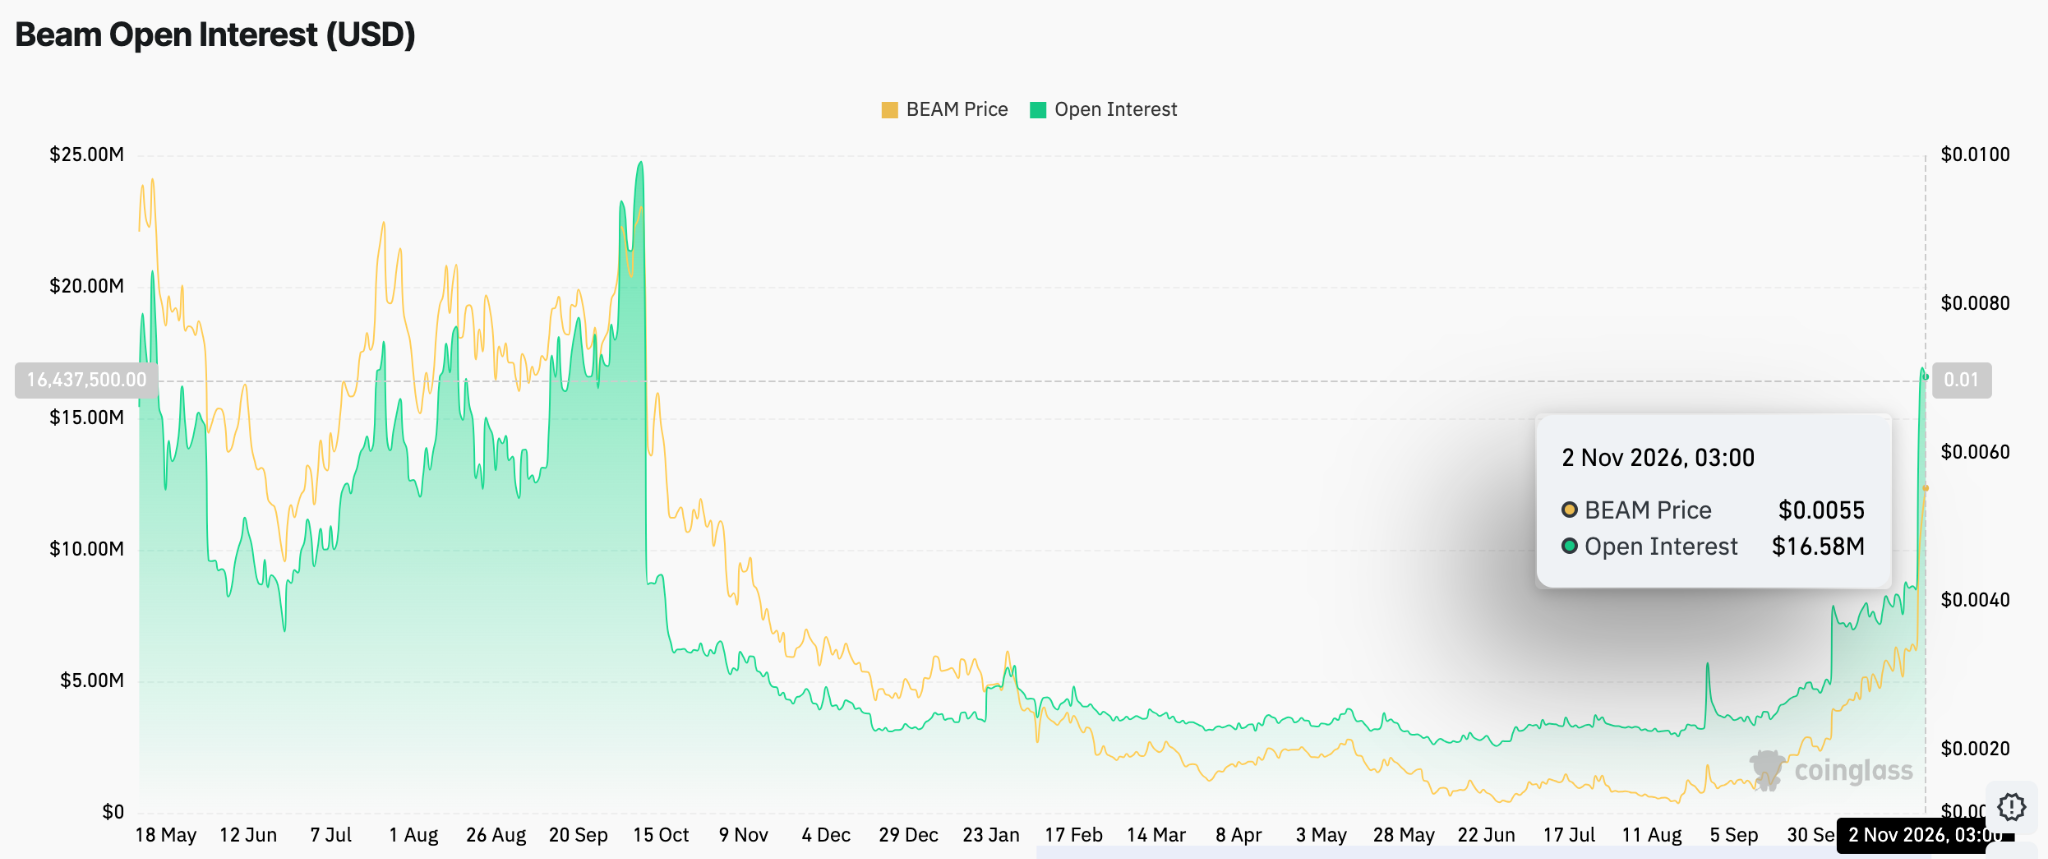
The increase suggests traders have opened additional derivatives positions during BEAM’s recent rally. However, rising open interest does not reveal whether traders favor bullish or bearish positions.
Consequently, the growing exposure could amplify volatility during the next significant price movement. A sharp reversal could trigger liquidations if heavily leveraged traders face unfavorable conditions.
Exchange Outflows Offer a Potentially Positive Signal
Exchange flow data presents another development worth monitoring. BEAM recorded approximately $50,070 in net exchange outflows on November 2.
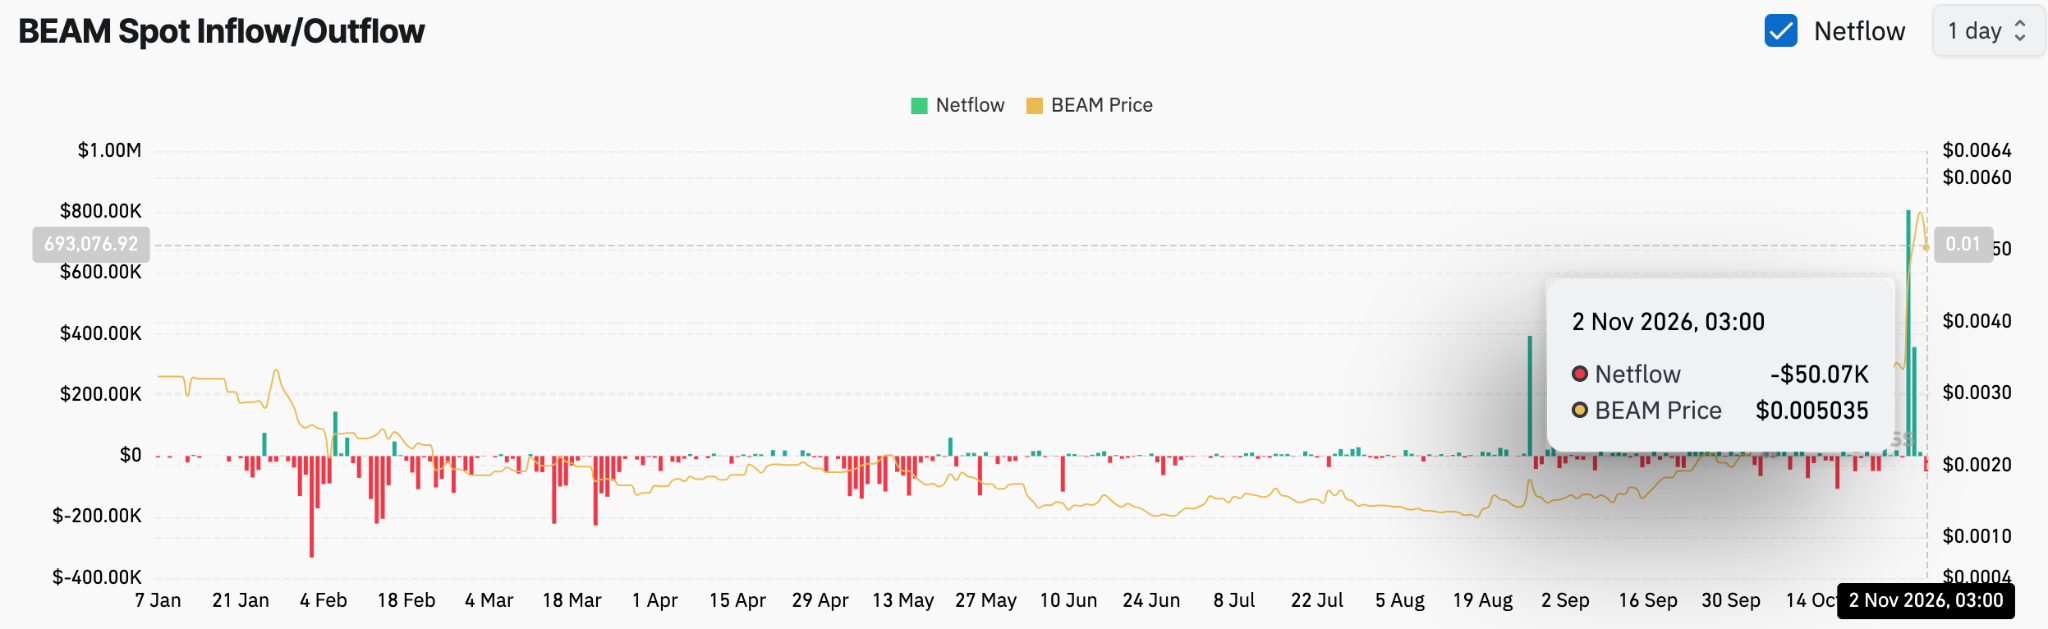
This development followed a substantial inflow surge during the recent rally. Net inflows previously approached $800,000, potentially increasing the tokens available for exchange trading.
Significantly, the latest reversal suggests more BEAM tokens left exchanges than entered them. Sustained withdrawals could reduce immediately available selling supply.
Technical Outlook For Beam (BEAM) Price
Key levels remain well-defined as BEAM navigates its latest correction:
Upside levels: $0.0052 represents the immediate resistance. A breakout could open the way toward $0.0057 and the recent high of $0.0063.
Downside levels: $0.004375 (0.618 Fibonacci) is the first major support, followed by the $0.00378-0.00372 zone, where Fibonacci support aligns with the 20-day EMA.
Trend support: The 20-day EMA at $0.003716 remains an important level for preserving the broader bullish structure. BEAM continues trading above its 20-, 50-, 100-, and 200-day EMAs.
Market signals: Open interest has climbed to $16.58 million, approaching its previous $25 million peak. Meanwhile, exchange netflows recorded an outflow of $50,070, suggesting reduced exchange supply.
Will Beam Price Go Up?
BEAM’s price prediction hinges on whether buyers can defend $0.004375 and regain momentum above $0.0052. Rising open interest indicates increased derivatives participation, while recent exchange outflows could provide additional support. If bullish momentum returns, BEAM could revisit $0.0057 and potentially challenge $0.0063.
Related: MEET48 Price Prediction: Can a 208% Weekly Rally Push IDOL Toward $0.030?
However, failure to maintain the $0.004375 support could expose the $0.00378-0.00372 region. A sustained breakdown below this area would weaken the bullish structure and increase downside risks. For now, BEAM remains at a critical turning point. Derivatives positioning, exchange flows, and confirmation from the daily chart will likely determine its next major move.
Disclaimer: The information presented in this article is for informational and educational purposes only. The article does not constitute financial advice or advice of any kind. Coin Edition is not responsible for any losses incurred as a result of the utilization of content, products, or services mentioned. Readers are advised to exercise caution before taking any action related to the company.