

- Bitcoin ETFs posted negative $2.1B in 30-day outflows as institutional demand weakened.
- Treasury firms and Strategy demand stayed near zero while BTC held above $65K.
- RSI and MACD remained bullish, signaling Bitcoin momentum stayed intact.
Bitcoin remained near the $65,700 level even as several major institutional demand indicators turned negative, highlighting a shift in capital flows without leading to a comparable decline in price. On-chain analyst Darkfost cited data from Checkonchain showing that demand from spot Bitcoin ETFs, corporate treasury companies, and Strategy has slowed compared with earlier phases of the market cycle.
Despite weaker inflows from these groups, Bitcoin has continued to trade above $65,000, suggesting recent price action has remained stable during the latest pullback.
Institutional Capital Flows Continue to Decline
According to Darkfost, spot Bitcoin ETFs recorded a 30-day net change of negative $2.1 billion. While ETF flows include both institutional and retail investors, he noted that some institutions may also use these products for hedging, broadening the figures beyond institutional demand alone.
The data also showed that Strategy’s Bitcoin demand has remained unchanged for several weeks. Treasury companies, excluding Strategy, followed a similar pattern. Their estimated demand stood at roughly $6.6 billion in August 2025, when Bitcoin traded near $115,000, but has since fallen to almost zero with Bitcoin trading around $65,000.
The Checkonchain chart tracked aggregate capital flows across spot ETF activity, Strategy demand, treasury company purchases excluding Strategy, futures open interest, realized capitalization, issuance, and changes in long-term holder supply.
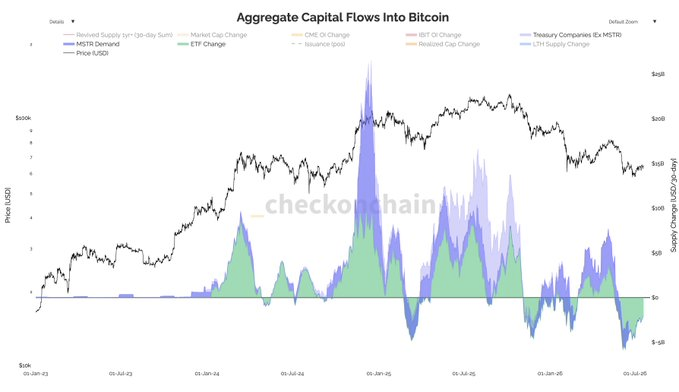
Earlier in the cycle, ETF inflows and futures activity contributed to strong positive capital movements that coincided with Bitcoin’s advance toward record highs. More recently, combined flows moved below the neutral level, indicating net capital outflows across several demand categories.
Technical Indicators Continue to Support Momentum
At the time of writing, Bitcoin traded at $65,672.82 with a market capitalization of $1.32 trillion and a 24-hour trading volume of $26.34 billion, according to CoinMarketCap.
The 14-day Relative Strength Index (RSI) stood at 57.55, remaining above the neutral 50 level and its 54.40 moving average, suggesting mild bullish momentum while staying below overbought territory.
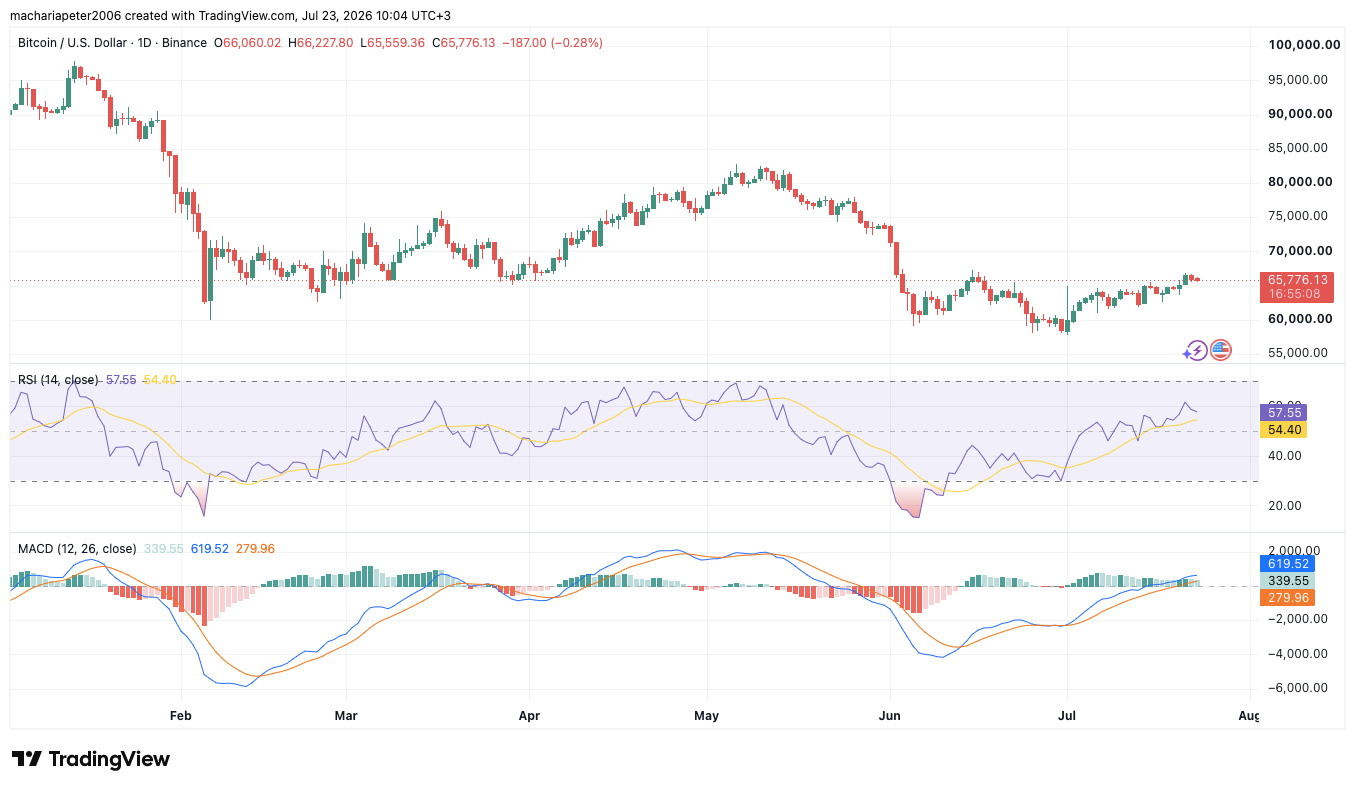
Meanwhile, the MACD remained positive, with the MACD line at 619.52 above the signal line at 279.96. The positive histogram reading of 339.55 showed bullish momentum remained intact, suggesting bullish momentum remained intact.
Related: Bitcoin Price Prediction: Is BTC’s CPI-Driven Jump the Start of a Recovery or Another Level to Sell?
Disclaimer: The information presented in this article is for informational and educational purposes only. The article does not constitute financial advice or advice of any kind. Coin Edition is not responsible for any losses incurred as a result of the utilization of content, products, or services mentioned. Readers are advised to exercise caution before taking any action related to the company.