


- Bitcoin experienced a minor decline during the weekend.
- However, there has been a reversal in bearish sentiments
- Price volatility remains unlikely in the short term.
The cryptocurrency market managed a comeback on Monday, following a weekend of bearish sentiment and selling pressure.
After a week of declining prices and increasingly negative social activity, Bitcoin (BTC) reversed course, surging back above $43,000 at the time of writing.
In a recent post on X (formerly Twitter), on-chain data provider Santiment noted that the bullish reversal in BTC’s performance mirrors a well-known pattern in the market when smaller traders exit the market out of fear. Larger investors often see an opportunity to buy, propelling prices back up.
According to the analytics firm, this dynamic appears to be playing out again, as the negativity surrounding BTC last week has been replaced by a renewed sense of optimism.
Demand for BTC sees surge
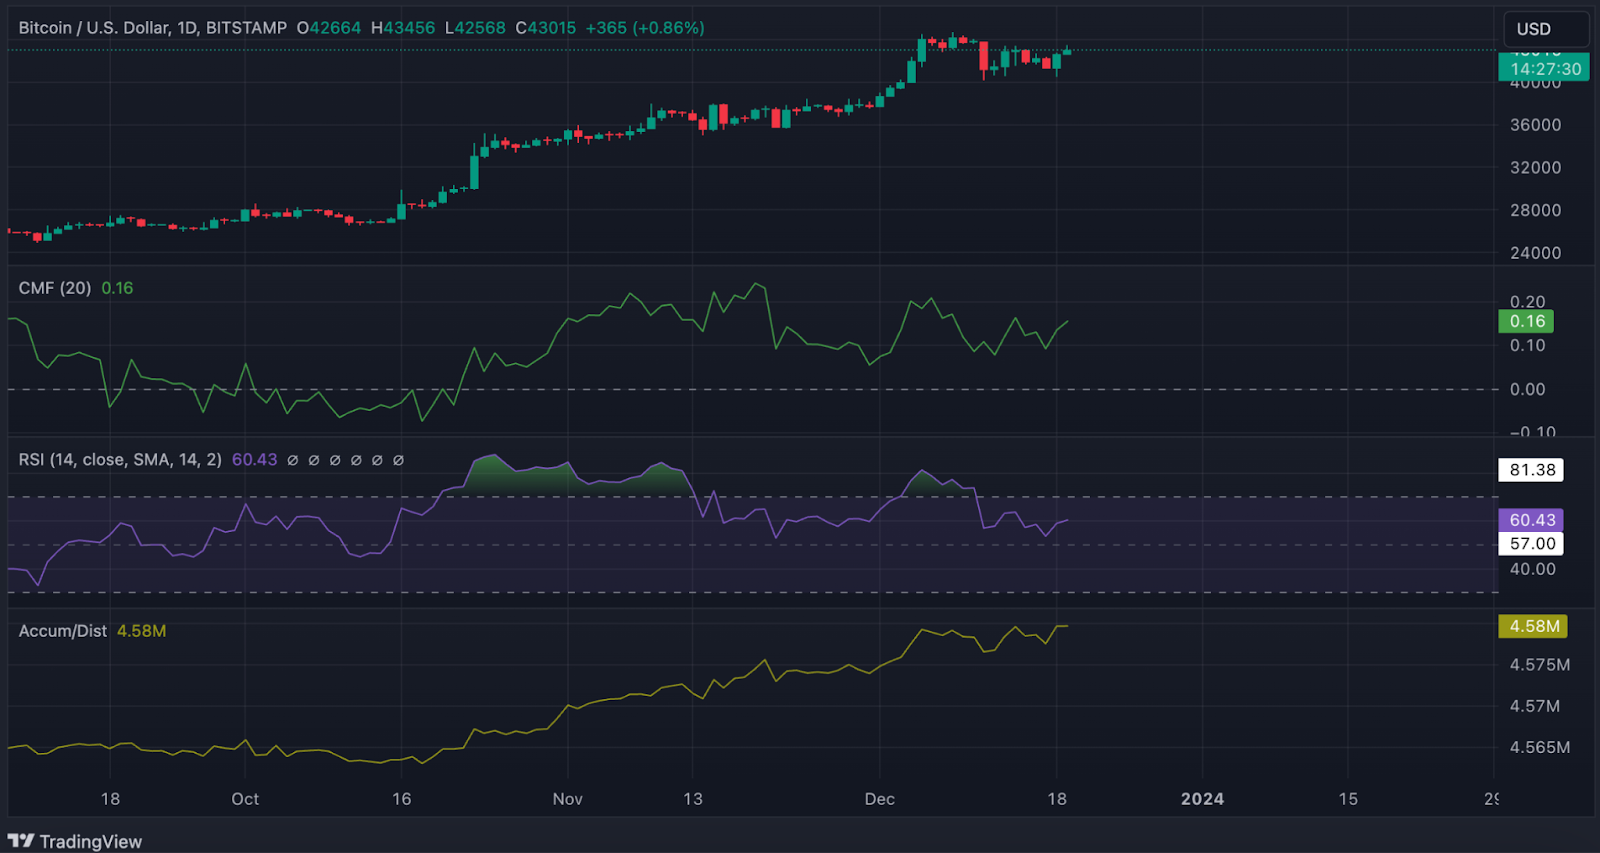
An assessment of BTC’s key momentum indicators on a 24-hour price chart confirmed the renewed optimism. There has been an upswing in demand for the coin among daily traders.
Positioned in an uptrend at press time, the coin’s Relative Strength Index (RSI) was spotted at 60.57 at press time. This showed that traders favored BTC accumulation over coin distribution.
Likewise, the coin’s Chaikin Money Flow (CMF) was 0.16. Also in an uptrend and positioned above the zero line as of this writing, it signaled that the BTC market witnessed a steady liquidity inflow.
Further, following a brief decline, BTC’s Accumulation/Distribution line resumed its upward trend on December 16 and has since risen by 0.21%.
When an asset’s accumulation/distribution line rises, the volume of coin purchases exceeds that of sales. This is often regarded as a bullish signal, suggesting potential price increases in the future.
BTC consolidates within a narrow range
Due to the uptick in profit-taking activity in the last week, BTC’s price has oscillated within the narrow price range of $42,800 and $43,200.
This was confirmed by its Choppiness Index (CI), which returned a value of 58 at press time. This technical analysis indicator measures the trendiness or choppiness of a market.
At 58, BTC’s CI showed that its price might experience price swings but within a defined range as it currently does.
This is supported by the fact that the coin’s volatility markers trended downward at press time. This suggested a steady decline in the possibility of any significant price changes in the short term.
For example, the coin’s Bollinger Bandwidth, which is used to measure market volatility, has declined by 34% since December 16.
Disclaimer: The information presented in this article is for informational and educational purposes only. The article does not constitute financial advice or advice of any kind. Coin Edition is not responsible for any losses incurred as a result of the utilization of content, products, or services mentioned. Readers are advised to exercise caution before taking any action related to the company.


