






- The four-year Bitcoin cycle model points to a bottom between Oct 6 and Oct 16.
- LTH to STH realized cap ratio sits at 3.9, nearing the 4.0 bottom signal closely.
- Neither indicator confirms a bottom, but both point to historically bullish conditions.
Bitcoin may be entering a historically important phase as two separate market indicators flash signals previously associated with major cycle bottoms. One model identifies a potential bottoming window in October, while another shows long-term holders gaining an increasingly larger share of Bitcoin’s realized capital.
Four-Year Cycle Points to October
The four-year cycle model tracks Bitcoin’s repeated pattern of tops, distribution, bear markets, accumulation, and markup phases. According to analyst Ali Charts, the model points to a possible bottom between October 6 and October 16.
The model has aligned with prior cycle lows with reasonable accuracy. Bitcoin currently sits in the late accumulation phase of its fourth major cycle, the same structural position it held before the recoveries of 2015, 2019 and late 2022.
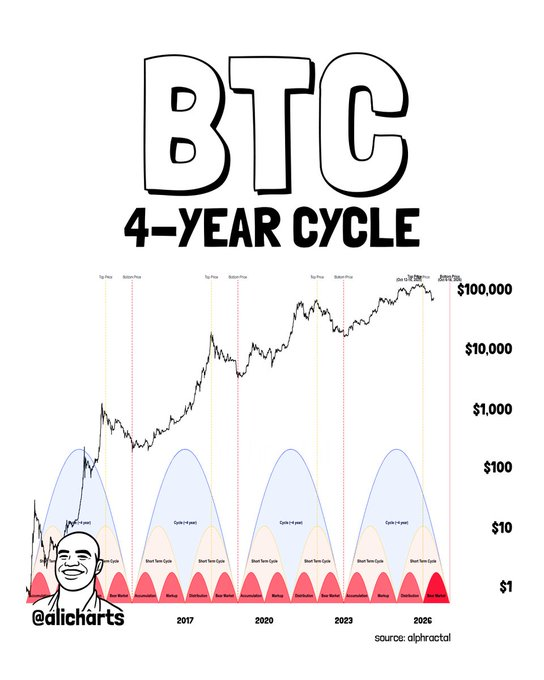
The current bear market fits the same bell-curve shaped accumulation pattern seen before each prior bull run.
Long-Term Holders Are Absorbing the Market
A second signal comes from the LTH/STH Realized Cap Ratio, tracked by Alphractal’s Joao Wedson. The metric compares realized capital held by long-term holders against realized capital held by short-term holders. Each time this ratio has climbed above 4 in Bitcoin’s history, the market was forming a major cycle bottom. It currently sits at 3.9.
Wedson said realized capital is now heavily concentrated among long-term holders compared to short-term holders. He added that ownership is shifting toward investors with stronger conviction, while short-term speculative activity remains weak.
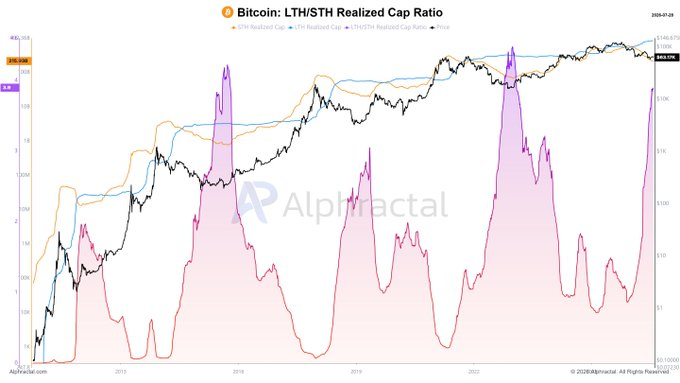
In simple terms, impatient capital has largely left the market. What remains sits in wallets belonging to investors who have shown, through their holding behavior, that they aren’t selling. That structure has historically appeared during advanced accumulation phases, just before bottoms form.
The ratio does not confirm that a market bottom has already formed. At 3.9, it is approaching, but has not yet crossed, the threshold that marked the previous two major cycle lows. According to Wedson, the indicator is approaching a zone historically associated with Bitcoin bottoms rather than signaling a confirmed reversal.
Both Models Point to a Historically Important Zone
Although the two indicators measure different aspects of the market, both currently suggest Bitcoin is approaching a historically significant area. Ali’s model identifies a potential time window based on previous four-year cycles, while Wedson’s realized cap ratio highlights increasing conviction among long-term holders.
Neither indicator guarantees that Bitcoin has already reached its cycle bottom. Instead, both suggest that market conditions are beginning to resemble those seen during previous accumulation phases that preceded long-term recoveries.
Related: Bitcoin Trading Volume Falls to Lowest Level Since 2023 as Market Activity Weakens
Disclaimer: The information presented in this article is for informational and educational purposes only. The article does not constitute financial advice or advice of any kind. Coin Edition is not responsible for any losses incurred as a result of the utilization of content, products, or services mentioned. Readers are advised to exercise caution before taking any action related to the company.




