

- TIA rallies 27% as buyers target the $0.70–$0.7149 resistance zone for a breakout.
- Open interest rebounds to $113.77M, signaling renewed trader participation in TIA.
- Spot inflows reach $2.71M as buying demand strengthens and supports TIA’s recovery.
Celestia (TIA) has staged a strong recovery, with its price climbing 27.04% in 24 hours as buyers return to the market. The token trades near $0.6655, extending its weekly gains to 29.57% and lifting its market capitalization to approximately $653.69 million.
TIA Price Breakout Puts $0.70 Resistance in Focus
TIA’s daily chart shows a significant improvement in buying momentum following its recovery from $0.2938. The token has climbed above its four major exponential moving averages (EMAs), signaling stronger upward momentum across multiple timeframes.
Moreover, TIA has reclaimed the $0.6254 Fibonacci resistance level, which now serves as immediate support. This development gives buyers a stronger foundation as the price approaches the $0.7000-0.7149 resistance zone.
A decisive daily close above $0.7149 could open the door toward $0.7500. Consequently, a sustained breakout could attract additional momentum traders and extend the recovery toward $0.7800.
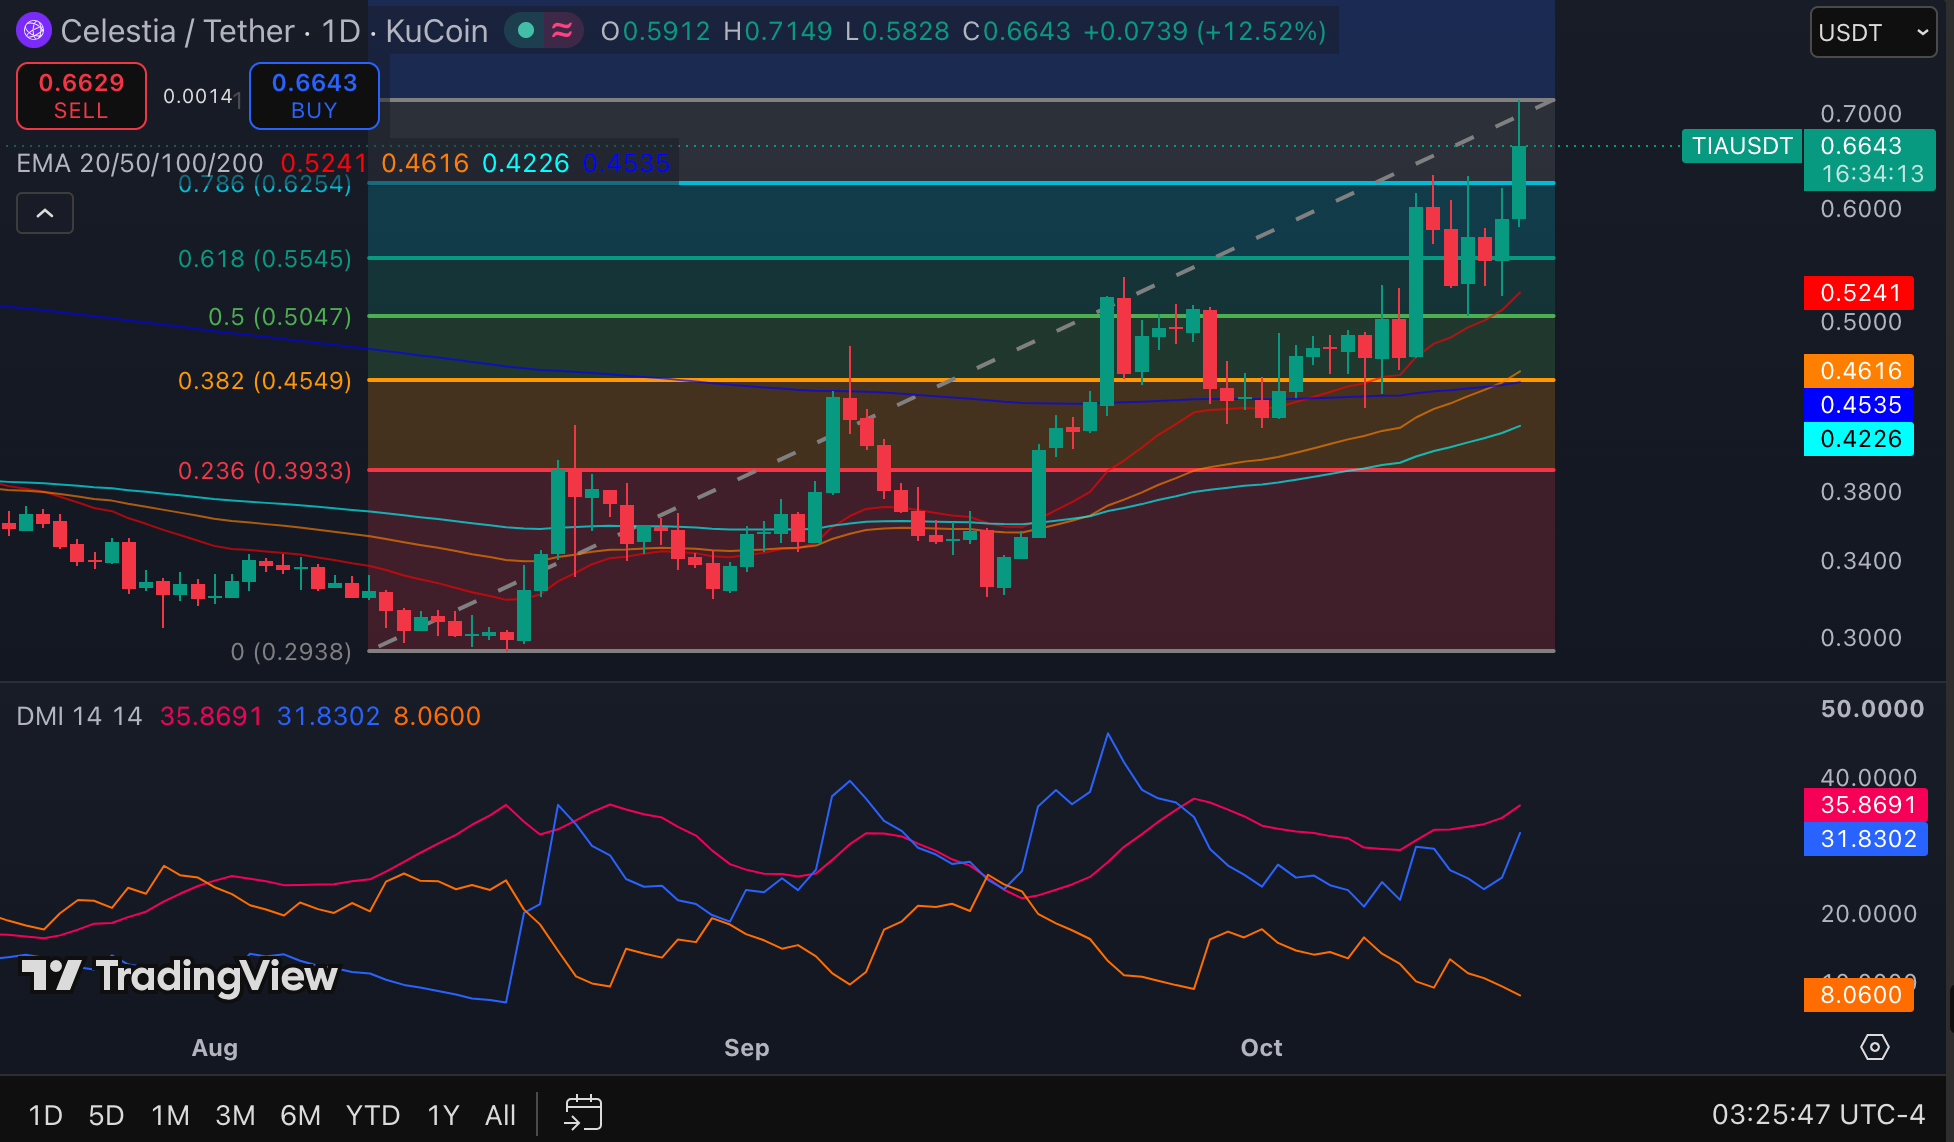
However, rejection near $0.7000 could encourage short-term profit-taking after the rapid advance. TIA would then need to defend $0.6254 to preserve its bullish structure. A deeper correction could expose support near $0.5545, followed by the 0.5047–0.5241 zone.
Related: Chainlink Price Prediction: LINK Eyes $13.50 as Stellar Launch Meets Trendline Support
The 20-day EMA stands at $0.5241, above the longer-term averages. Additionally, the Directional Movement Index (DMI) supports the bullish case, with the average directional index (ADX) at 35.87. The positive directional indicator also leads significantly, registering 31.83 against the negative indicator’s 8.06.
Open Interest Signals Renewed Trader Participation
Celestia’s derivatives market also shows signs of renewed activity following an extended period of declining participation. Open interest fell from above $250 million in July 2025 to below $50 million during early 2026.
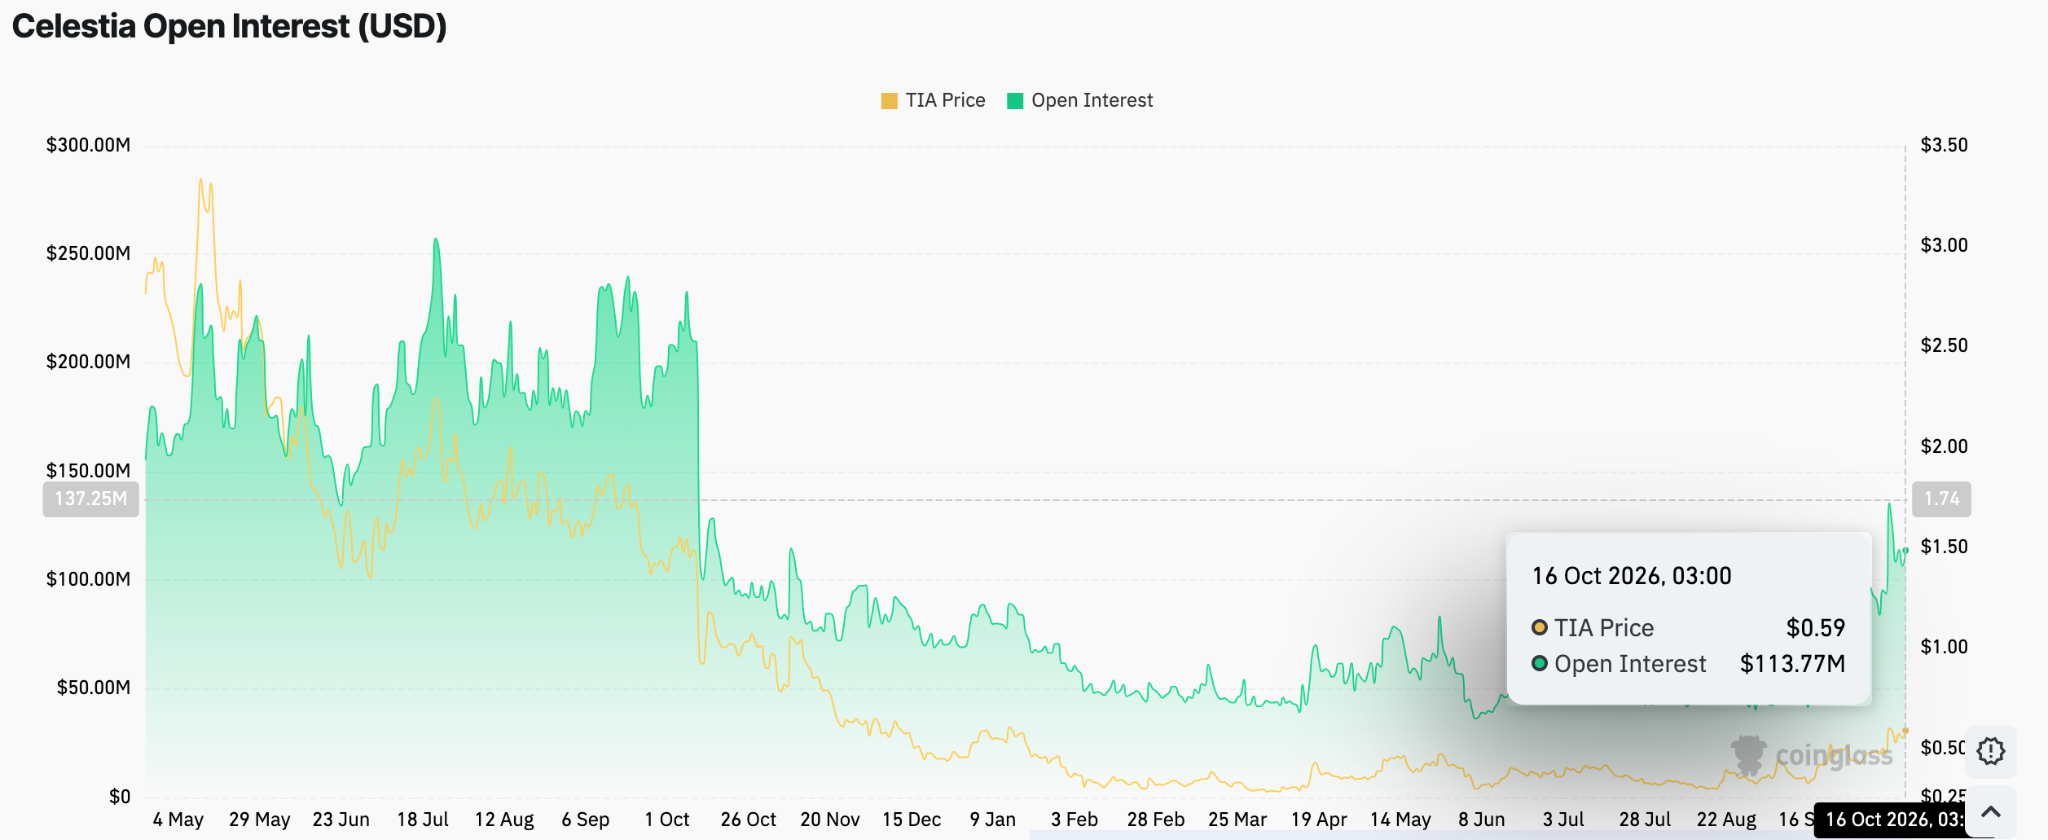
However, open interest subsequently rebounded toward $137 million before easing to approximately $113.77 million on October 16. This recovery suggests traders have begun opening new positions as TIA’s price strengthens.
Significantly, open interest above $120 million could reinforce the current rally if buying pressure persists. Conversely, a decline below $100 million could indicate weakening participation and reduced confidence in the recovery.
Spot Inflows Strengthen the Bullish Case
TIA’s spot market provides another encouraging signal. September and early October featured repeated net outflows, with several sessions recording withdrawals exceeding $1 million.
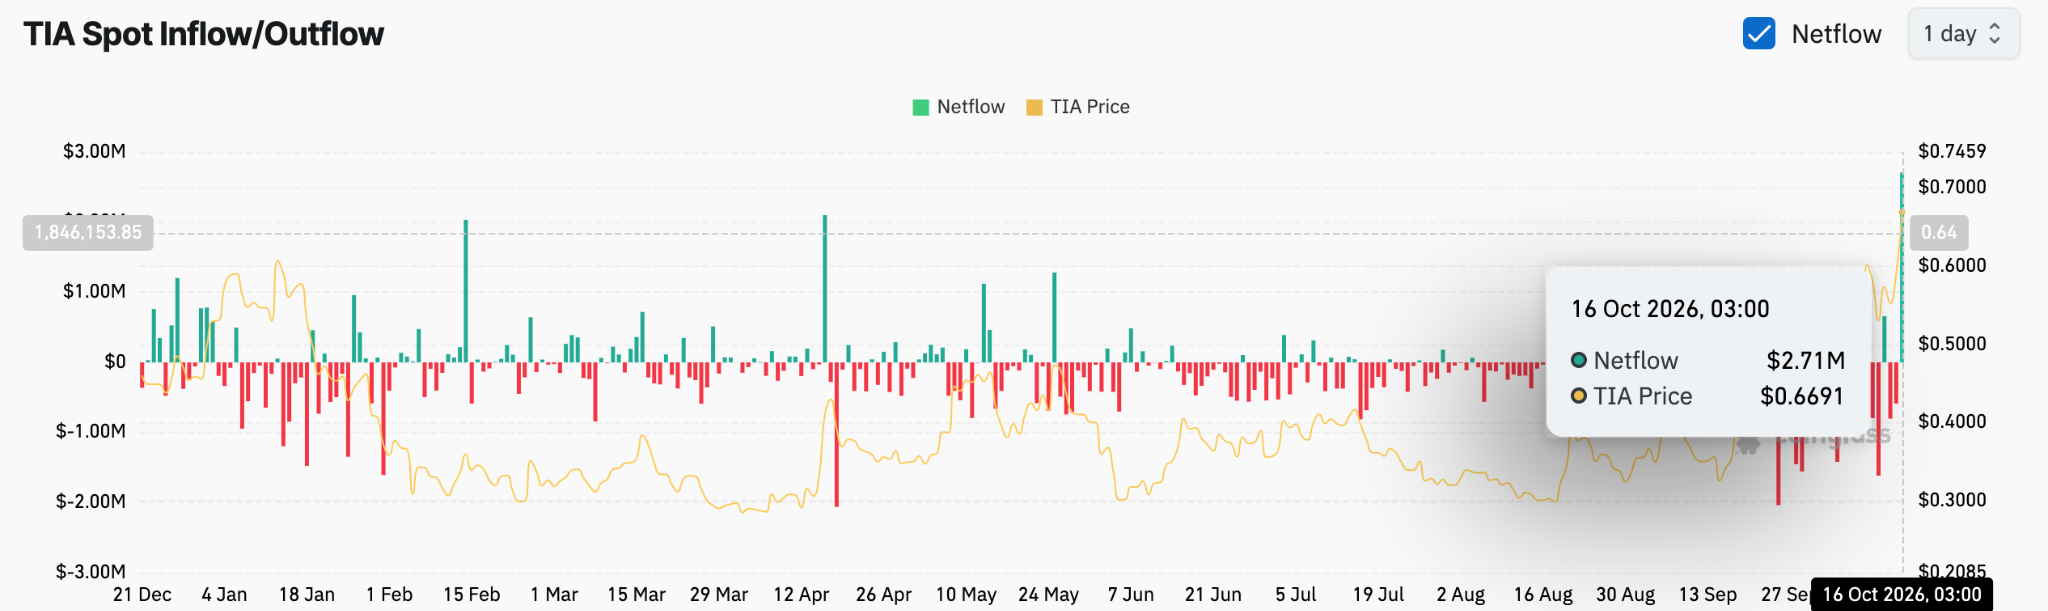
These movements suggested persistent selling pressure and limited conviction among buyers. However, October 16 brought a sharp reversal as net inflows reached $2.71 million.
Related: NEAR Protocol Price Prediction: NEAR Gains 12% as Derivatives Activity Climbs Above $1.5 Billion
The increase coincided with TIA climbing toward $0.6691, suggesting stronger demand accompanied the latest price advance. Moreover, sustained inflows could help support prices as the token approaches resistance.
Technical Outlook for Celestia (TIA) Price
Key levels remain well-defined as Celestia builds on its recent rally.
Upside levels: $0.700-0.7149 represent the immediate resistance zone. A decisive breakout could push TIA toward $0.7500 and $0.7800.
Downside levels: $0.6254 serves as immediate support, followed by $0.5545 and the $0.50470.5241 support zone. The technical picture favors buyers, with TIA trading above its major daily EMAs and the DMI showing strong bullish momentum. However, the sharp rally could trigger short-term consolidation near resistance.
Will Celestia Price Go Up?
Celestia’s price prediction hinges on whether buyers can defend $0.6254 and overcome resistance between $0.7000 and $0.7149. Rising spot inflows and recovering open interest suggest renewed market participation.
If buying pressure continues, TIA could advance toward $0.7500 and potentially $0.7800. However, a rejection near $0.7149 could trigger profit-taking and a retest of $0.6254.
Related: Injective Price Prediction: INJ Breaks Above Trendline as CEO Meets US Officials
A breakdown below this level would expose $0.5545 as the next significant support. For now, TIA maintains a bullish short-term outlook, but sustained inflows and a confirmed resistance breakout will determine its next move.
Disclaimer: The information presented in this article is for informational and educational purposes only. The article does not constitute financial advice or advice of any kind. Coin Edition is not responsible for any losses incurred as a result of the utilization of content, products, or services mentioned. Readers are advised to exercise caution before taking any action related to the company.