



- Ethereum price prediction for November stays bearish below $2,315, with $2,222 the support to hold
- US spot Ethereum ETFs lost $1.61 billion in October, ending a three-month inflow run
- ETH’s median November return is -1.96%, against a +4.03% average, per CryptoRank data
Ethereum price prediction for November stays bearish below $2,315, the 200-day average ETH needs to reclaim after October’s 16.1% drop.
Ethereum’s November Outlook Hinges on $2,315
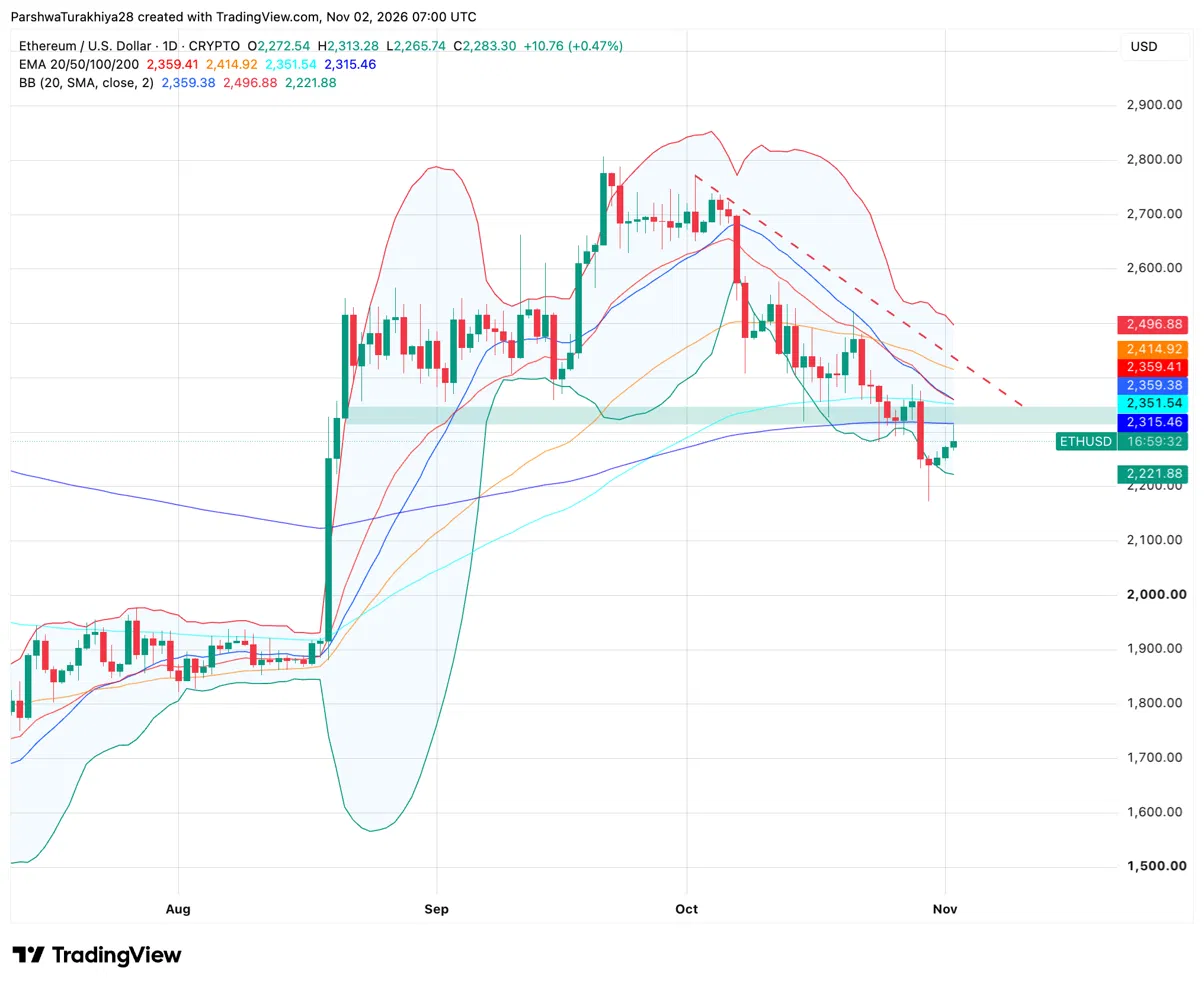
ETH rose 0.47% to $2,283.30, about 1.4% below its 200-day EMA at $2,315.46. A daily close above that average would be the first sign that the late-October rebound is gaining strength.
Buyers would then face resistance between $2,351 and $2,360. The 100-day EMA sits at $2,351.54, while the 20-day EMA and Bollinger Band midline both sit near $2,359. Above that range, the next hurdles are the 50-day EMA at $2,414.92 and a falling trendline near $2,440.
Related: Bitcoin Price Prediction November 2026: Can BTC Reclaim $80,225 as ETF Flows Turn Negative?
While ETH trades below $2,315, a November retest of $2,222 looks more likely than a rally above $2,415. The lower Bollinger Band sits at $2,222. A daily close below it would bring the late-October low near $2,170 back into view.
ETH Support and Resistance Levels, November 2026
| Type | Price | Why it matters |
| Resistance | $2,315 | 200-day EMA |
| Resistance | $2,360 | 20-day EMA and Bollinger midline, beside the 100-day at $2,352 |
| Resistance | $2,415 | 50-day EMA |
| Support | $2,222 | Lower Bollinger Band |
| Support | $2,170 | Late-October wick low |
| Support | $2,000 | Round level |
US Spot Ethereum ETFs Post Their Largest Monthly Outflow as a Three-Month Inflow Run Ends
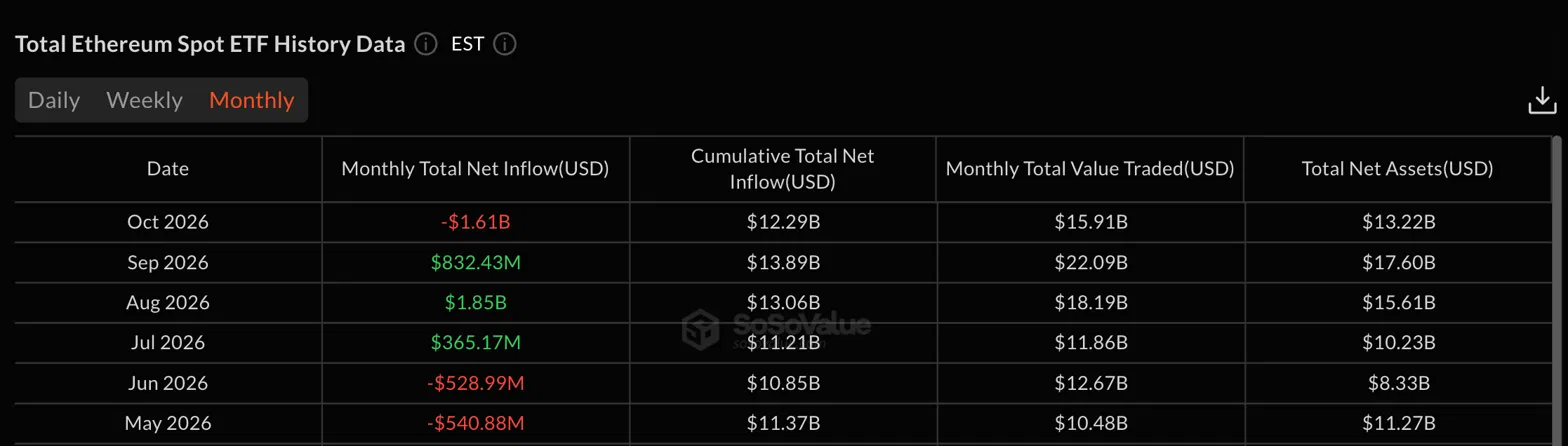
US spot Ethereum ETFs lost $1.61B in October, ending three straight months of inflows that took in about $3.05B between July and September. A report on the flows calls it the largest monthly outflow since the funds launched in July 2024.
Related: Beam Price Prediction: BEAM Faces Selling Pressure as Open Interest Surges
It came as ETH fell 16.1%, its weakest October since 2016. Cumulative net inflows slipped to $12.29B, and total net assets dropped about 25% to $13.22B from $17.60B at the end of September.
Raoul Pal Frames an $18,000 Ethereum Scenario Around Government Debt Refinancing
A Crypto Nutshell video built on Raoul Pal’s Token2049 keynote and later interviews argues that refinancing US government debt will keep pushing new liquidity into markets. It cites a Joint Economic Committee estimate that about a third of US marketable debt matures within 12 months, with total federal debt above $40 trillion.
- Rates: Pal expects the next 100 basis points of Fed moves to be cuts rather than hikes, after the September hike to a 3.75% to 4% range.
- Ethereum link: The video says about $300 billion of stablecoins are in circulation and roughly 48% sit on Ethereum, citing DefiLlama.
- Scenario: In Pal’s trend-channel work, ETH reaches about $18,000 around the second quarter of 2027 if it tops out one standard deviation above trend. He also showed an extreme case near $60,000 that he said is not a prediction.
From $2,283.30, the $18,000 scenario would be about 7.9 times today’s price.
Ethereum Fell 16.1% in October. How Often Does It Rebound in November?
ETH fell 16.1% in October, its third straight October loss. Only October 2016 was worse in CryptoRank’s 12-year record, when ETH fell 16.7%. The median October gain was 1.42%.
ETH has gained 4.03% on average in November, but it rose in only five of 11 years. Three big rallies explain the gap. ETH gained 58.7% in 2020, 47.4% in 2024 and 46.2% in 2017. It lost about 13% on average across the other eight Novembers.
After an October loss, ETH fell again in November in three of four previous cases. The 2024 rally was the only exception. ETH also fell in both previous U.S. midterm Novembers, losing 42.5% in 2018 and 17.6% in 2022.
What would those returns mean from $2,283?
- Downside: A repeat of November’s median loss of 1.96% would put ETH near $2,239, just above support at $2,222.
- Upside: A repeat of November’s average gain of 4.03% would put ETH near $2,375. Buyers would first need to clear the 200-day EMA near $2,315, then resistance around $2,359.
Ethereum Price Prediction: Week-by-Week Forecast for November 2026
The base case has ETH capped below the $2,315 to $2,360 cluster, retesting the $2,222 lower band at least once, and ending the month in a $2,200 to $2,400 range.
| Period | Expected range | Key levels | What decides it |
| Nov 1 to 7 | $2,180 to $2,360 | $2,222 support, $2,315 resistance | Whether the 200-day EMA is reclaimed |
| Nov 8 to 14 | $2,150 to $2,400 | $2,222 support, $2,360 resistance | A test of the EMA cluster |
| Nov 15 to 21 | $2,100 to $2,420 | $2,170 support, $2,415 resistance | Whether ETF outflows continue |
| Nov 22 to 30 | $2,050 to $2,500 | $2,222 support, $2,415 resistance | Direction into month-end |
Related: MEET48 Price Prediction: Can a 208% Weekly Rally Push IDOL Toward $0.030?
FAQs
ETH stays bearish below $2,315 and could move toward $2,415 if it closes above the 200-day EMA and the 20-day EMA at $2,359. A daily close below the lower Bollinger Band at $2,222 would put the $2,170 late-October low in play.
November has been mixed, with a median return of -1.96% and only 5 of 11 completed Novembers positive, according to CryptoRank data. The +4.03% average is lifted by 2020, 2024 and 2017, and ETH fell in both midterm-year Novembers on record, 2018 and 2022.
US spot Ethereum ETFs lost $1.61B in October, ending three straight months of inflows, according to SoSoValue. Cumulative net inflows now stand at $12.29B.
ETH fell 16.1% in October, its weakest October since 2016, according to CryptoRank data, while US spot Ethereum ETFs lost $1.61B. The chart shows price below all four daily EMAs, but none of the data in this analysis ties the drop to a single cause.
Disclaimer: The information presented in this article is for informational and educational purposes only. The article does not constitute financial advice or advice of any kind. Coin Edition is not responsible for any losses incurred as a result of the utilization of content, products, or services mentioned. Readers are advised to exercise caution before taking any action related to the company.