

- Bitcoin holds $85K support as traders watch $87,395.67 for breakout confirmation.
- A close above $87,395.67 keeps the $91,013.66 higher-timeframe target in focus.
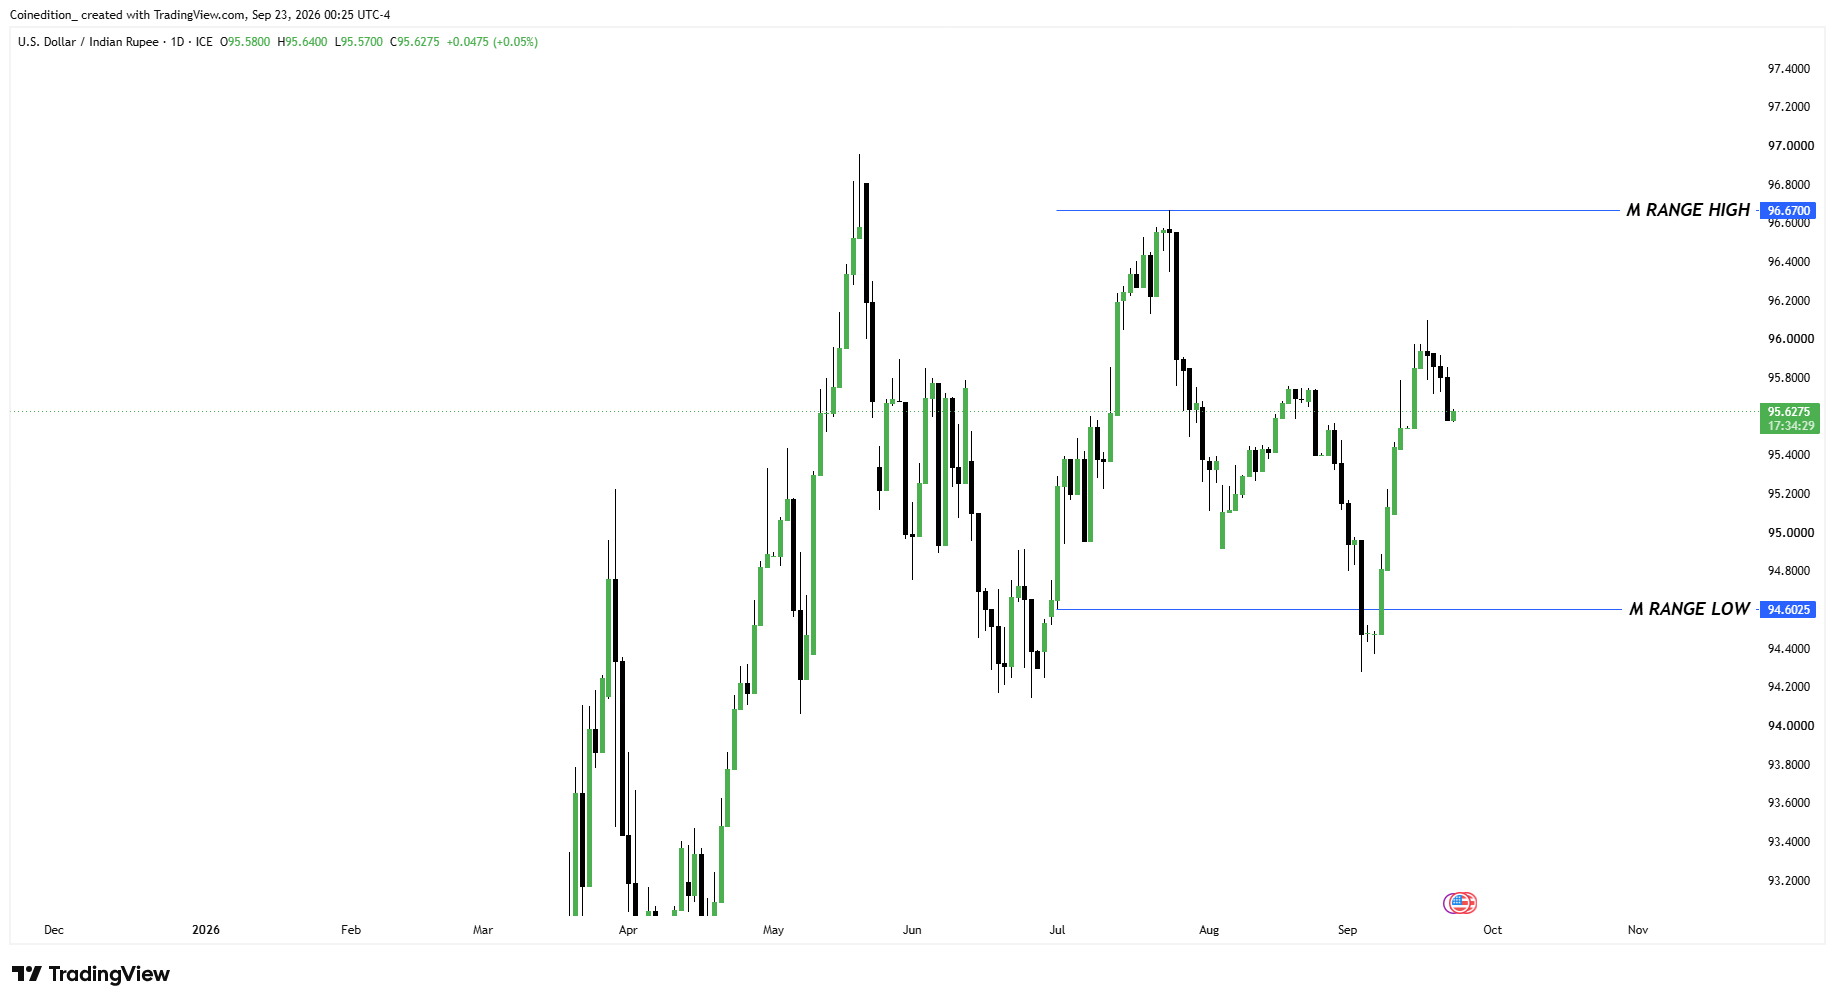
- USD/INR near 95.63 boosts rupee conversion value without confirming a BTC exit.
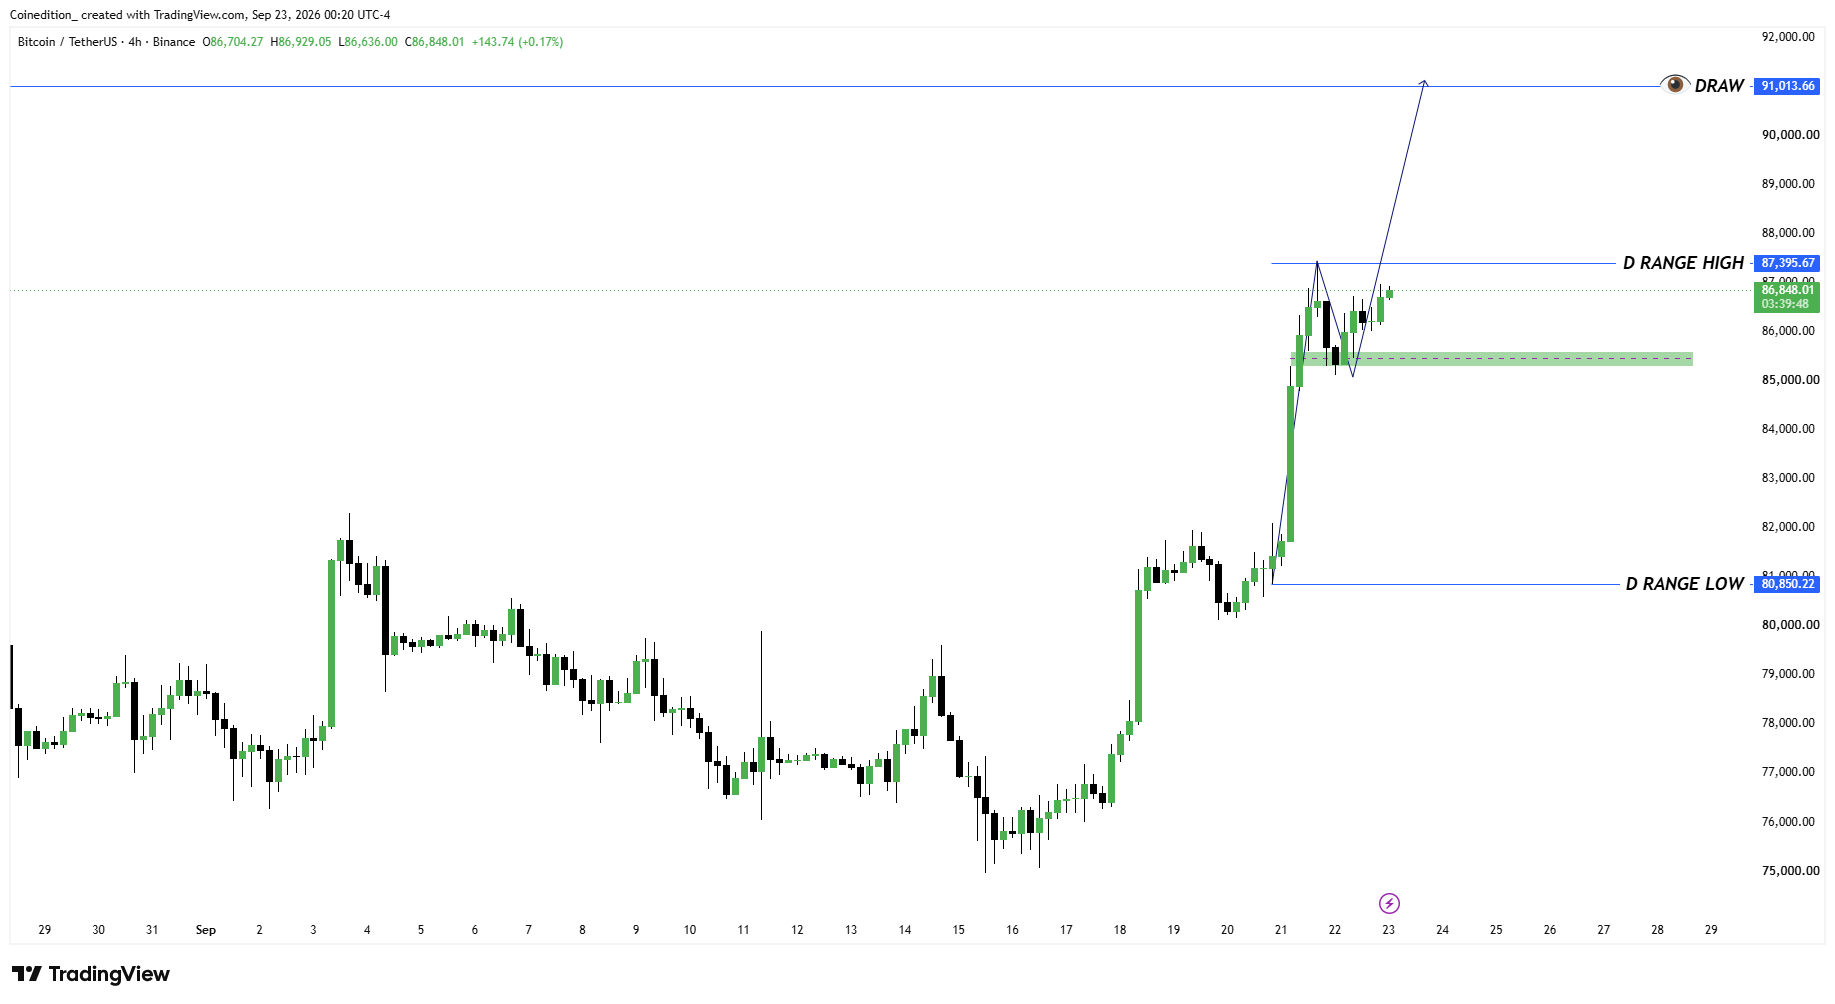
Bitcoin entered Wednesday with its bullish structure intact after Tuesday swept internal liquidity from Monday’s range. The four-hour chart places the price near $86,848, below $87,395.67.
A decisive Wednesday close above that level would show acceptance beyond Monday’s upper range and keep the $91,013.66 weekly order block in focus. For Indian traders, USD/INR near 95.63 adds another variable. A weaker rupee increases the INR value of dollar proceeds, but it does not confirm an exit.
Tuesday’s Internal Liquidity Sweep Sets the Bullish Context
Tuesday supplied the first technical signal. Bitcoin had advanced from below $82,000 before pulling back into the $85,000–$85,500 area. That decline swept internal liquidity, but buyers responded quickly.
As a result, BTC recovered toward $86,800 instead of extending into a broader breakdown. That rebound helped preserve the larger bullish structure, with price remaining above the $80,850.22 daily range low.
With that structure still intact, attention now shifts to whether buyers can confirm further expansion above the next resistance level.
Wednesday Close Could Confirm the Range Expansion
The immediate confirmation level sits at $87,395.67. Although BTC can briefly trade above resistance, an intraday move alone would not confirm a breakout. A wick above the level would only show temporary strength.
By contrast, a close above $87,395.67 would signal stronger acceptance beyond the previous range boundary. If that acceptance develops, the market would move closer to a confirmed range expansion. However, a rejection from the level would bring the $85K support area back into focus.
The $85K Support Zone Keeps $91,014 in Focus
The $85,000–$85,500 region remains the nearest support zone after buyers responded there following Tuesday’s liquidity sweep. As a result, another defended retest would help preserve the short-term bullish structure and keep the broader expansion setup intact.
However, a decisive loss of that area would weaken the rebound structure. In that case, $80,850.22 would become the next broader deterioration level to watch. As long as the $85K zone holds, attention can remain on the upside.
The chart places $91,013.66 as the next higher-timeframe objective, representing about a 4.8% rise from $86,848. From the $87,395.67 breakout level, the remaining distance is roughly 4.1%.
Therefore, the weekly order-block target remains conditional on Bitcoin first holding support and establishing acceptance above the daily range high. Without that confirmation, $91,014 remains an upside reference rather than a confirmed continuation target.
USD/INR and Weekend Volatility Context
Meanwhile, the currency backdrop adds another layer to the setup for Indian traders. USD/INR near 95.63 sits within the supplied 94.6025–96.6700 range, meaning each realized dollar converts into more rupees as the exchange rate rises.
As a result, rupee weakness can increase the local-currency value of BTC proceeds. However, that currency effect does not change Bitcoin’s underlying technical levels or confirm whether traders should exit their positions.
Weekend trading adds another consideration as crypto markets remain open while traditional markets close. Consequently, thinner liquidity can amplify short-term price moves around major levels.
That keeps $87,395.67 resistance and the $85K support zone central before the weekend, with both levels helping define whether the current structure extends or weakens.
Key Levels
| Level | Role |
| $91,013.66 | Higher-timeframe bullish draw |
| $87,395.67 | Daily range high |
| $85,000–$85,500 | Immediate reaction zone |
| $80,850.22 | Structural failure reference |
| 95.63 | Current USD/INR reference |
Continuation Case
Holding $85K and closing above $87,395.67 would strengthen expansion and keep $91,013.66 as the next higher-timeframe objective.
Failure Case
A rejection followed by a loss of $85,000–$85,500 would weaken the bullish thesis. A move toward $80,850.22 would signal deeper deterioration.
Bottom Line
The chart does not objectively signal that traders should withdraw profits immediately. Instead, it defines a framework around support, confirmation, and currency conversion. In the meantime, Bitcoin remains constructive while $85K holds.
A Wednesday close above $87,395.67 would strengthen the expansion case toward $91,013.66. For Indian traders, INR weakness near 95.63 improves rupee conversion value, but it does not replace technical confirmation.
FAQs
A sustained close above $87,395.67 would strengthen confirmation and keep $91,013.66 in focus.
Tuesday’s pullback swept liquidity there before buyers responded. Holding it preserves the immediate bullish structure.
A wick shows a temporary trade above resistance. A close suggests stronger acceptance.
The chart marks it as the higher-timeframe draw after confirmation above $87,395.67.
A decisive loss of $85K would weaken the setup, while movement toward $80,850.22 would represent deeper structural failure.
Related: Bitcoin Broke $85K: Was It Real Demand or a Short Squeeze?
Disclaimer: The information presented in this article is for informational and educational purposes only. The article does not constitute financial advice or advice of any kind. Coin Edition is not responsible for any losses incurred as a result of the utilization of content, products, or services mentioned. Readers are advised to exercise caution before taking any action related to the company.