
Bitcoin trades at $62,661 on July 17, down 1.74%, pulling back after two failed attempts to hold above $65,000 this week. ETF inflows have stayed positive through the volatility, but the double rejection at resistance and the slide back below the 20-day EMA are raising questions about whether the seasonal tailwind can carry through the final two weeks of the month.
BTC Price Today: Double Top at $65K Puts Seasonal Gain on Notice
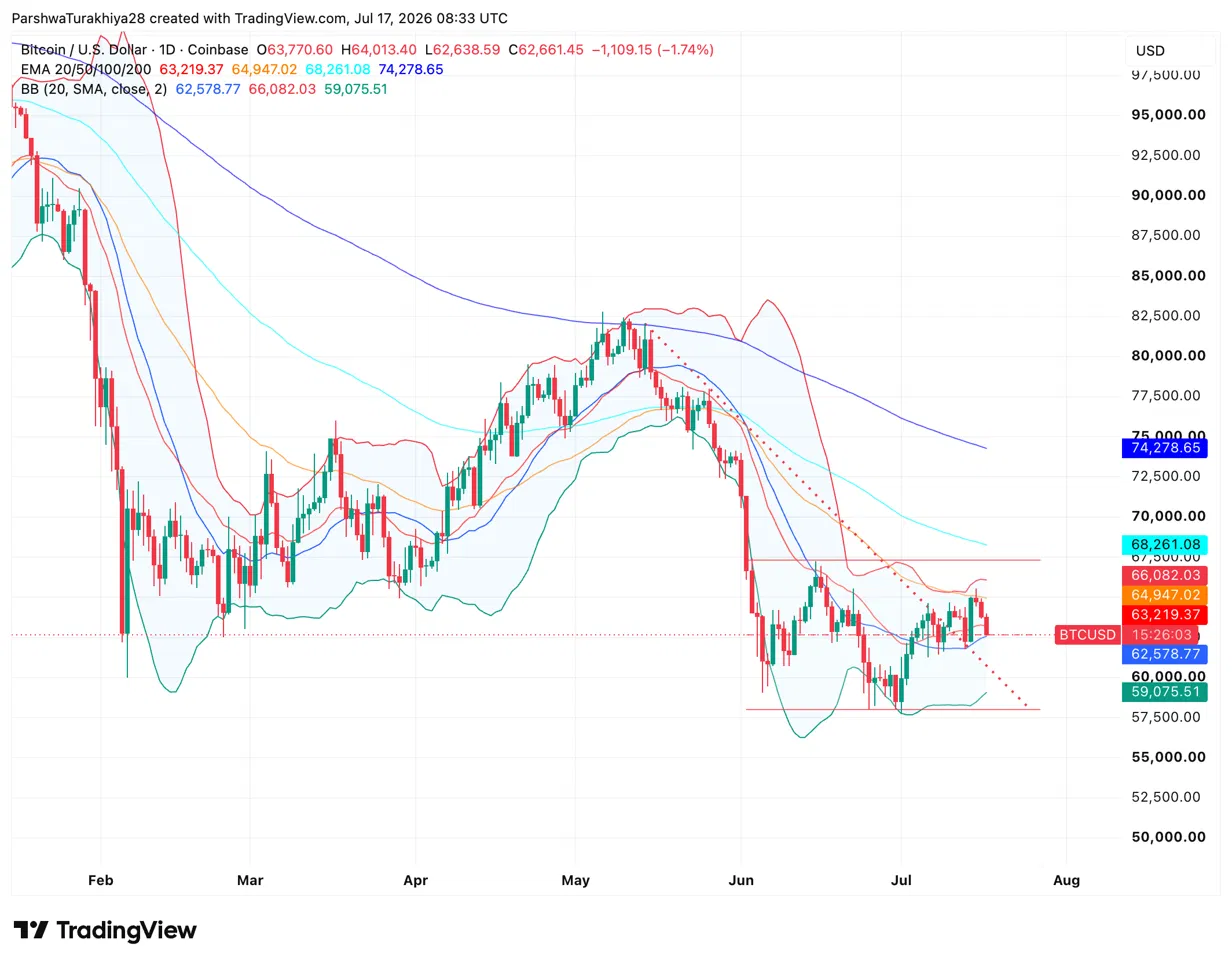
The daily chart shows BTC slipping back below the 20-day EMA at $63,219 after two rejections at the $65,000 area this week. The Bollinger midline at $62,578 is the immediate level now in play, sitting just below current price. A horizontal support band visible on the chart near $58,500 aligns with the lower Bollinger Band at $59,075, forming the floor bulls need to hold if selling extends through the weekend.
Above price, the 20-day EMA at $63,219 has flipped to resistance, followed by the 50-day at $64,947 and the Bollinger upper band at $66,082. The 100-day at $68,261 and 200-day at $74,278 remain well out of reach. Buyers showed up on Tuesday’s CPI data, pushed BTC to $65,235, and then twice failed to hold it, handing control back to sellers heading into the weekend.
Bitcoin Support and Resistance Levels — July 17, 2026
| Level | Price | Role |
| Bollinger Midline | $62,578 | Immediate support; must hold for bulls |
| 20-Day EMA | $63,219 | Flipped to resistance after breakdown |
| Horizontal Support Zone | ~$58,500 | Key floor aligning with lower Bollinger |
| Lower Bollinger Band | $59,075 | Downside target if midline fails |
| 50-Day EMA | $64,947 | Primary resistance; rejected BTC twice |
| Bollinger Upper Band | $66,082 | Upside target on confirmed recovery |
| 100-Day EMA | $68,261 | Extended resistance |
| 200-Day EMA | $74,278 | Longer-term bull target |
Bitcoin July Seasonality: 7.43% Gain Matches the 13-Year Average
Bitcoin’s July performance in 2026 is remarkable for how closely it mirrors historical norms. Across 13 years of data, July has produced a 7.59% average return and an 8.16% median, making it the third strongest month of the year behind October and November. July has closed green nine times in those thirteen years, with losses only in 2014, 2016, 2019, and 2023.
The current reading of 7.43% sits almost exactly on the historical average with two full weeks still remaining. In years where July finished positive, the final two weeks rarely reversed sharply without an external macro catalyst forcing the issue. The double rejection at $65,000 is the clearest near-term threat to that pattern holding in 2026.
BTC July 2026 Weekly Forecast
| Period | Price Range | Outlook |
| Jul 18-20 | $61,500-$63,500 | Testing Bollinger midline support after double rejection |
| Jul 21-25 | $62,000-$65,500 | Recovery attempt toward 50-day EMA if ETF inflows hold |
| Jul 28-31 | $63,000-$67,000 | Bullish resolution if seasonal pattern sustains momentum |
ETF Inflows Held Positive Through The Week’s Volatility
US spot Bitcoin ETFs logged $79.15M in net inflows on July 16 and $107.80M on July 15. BlackRock’s IBIT led with $33.44M, Fidelity’s FBTC added $30.73M, and Bitwise’s BITB contributed $14.98M on July 16.
Cumulative net inflows across all funds now sit at $51.22B with total net assets at $77.72B. The July 13 session saw $424.66M leave the category in a single day before buyers returned across the following three sessions, a pattern that suggests institutional demand steps in on dips rather than accumulating at strength.
BTC Derivatives Data: Overleveraged Longs Flushed, Not a Trend Reversal
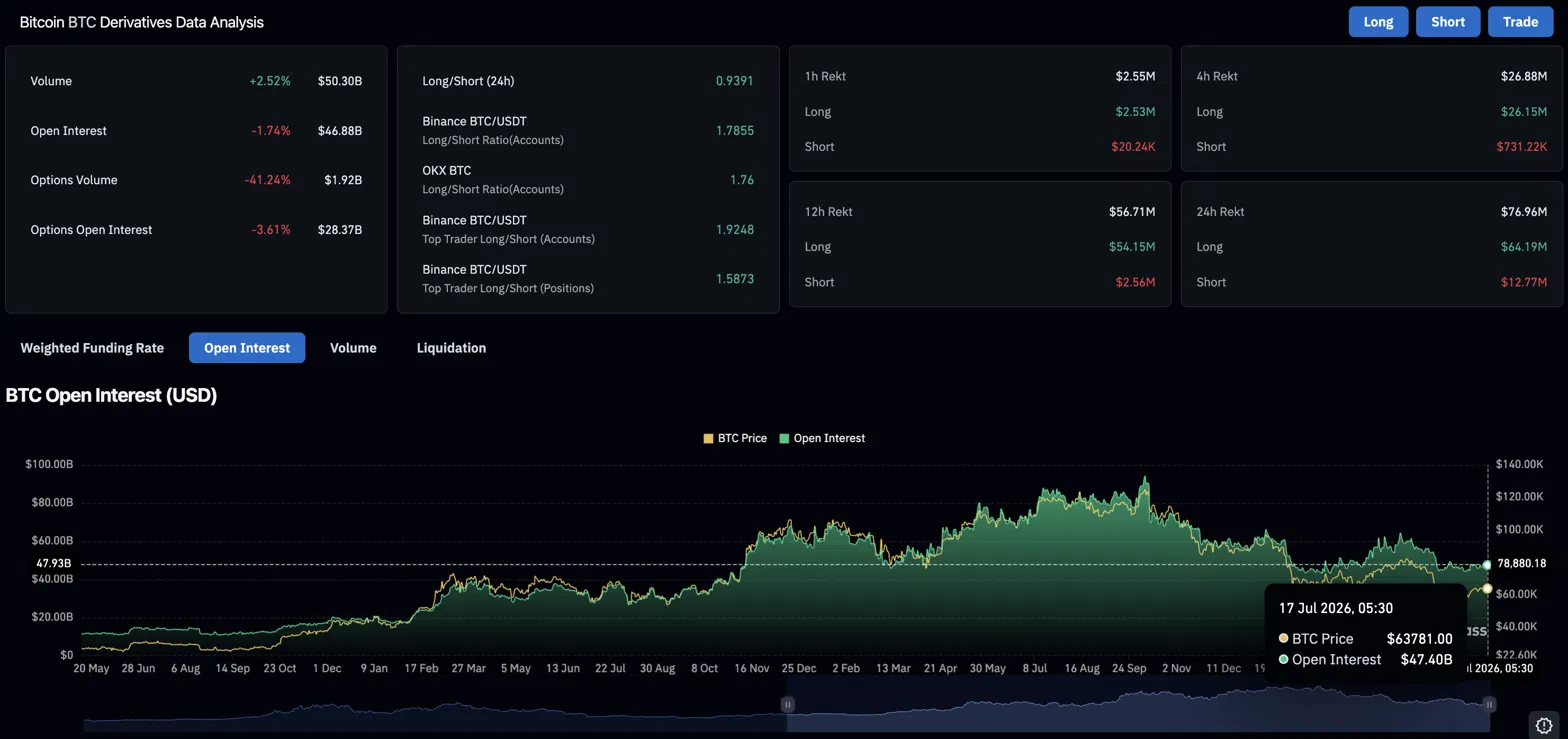
Derivative metrics on July 17 tell a nuanced story. Volume rose 2.52% to $50.30B while open interest fell 1.74% to $46.88B at the same time. That combination indicates position closures rather than fresh short-selling. When open interest drops alongside price, longs are exiting. New sellers are not the driving force.
Long liquidations over 24 hours hit $64.19M against just $12.77M for shorts, a 5:1 ratio that points firmly at overleveraged buyers being flushed out rather than a genuine shift in trend direction. Options volume dropped 41.24% to $1.92B, reflecting traders pulling back from directional bets after the week’s range between $62,000 and $65,235.
BTC Derivatives Overview — July 17, 2026
| Metric | Value | Interpretation |
| 24h Volume | $50.30B (+2.52%) | Rising volume on declining price = position closures |
| Open Interest | $46.88B (-1.74%) | Falling OI confirms longs exiting, not shorts entering |
| Options Volume | $1.92B (-41.24%) | Traders avoiding directional bets post-rejection |
| Long Liquidations (24h) | $64.19M | Overleveraged buyers cleared out |
| Short Liquidations (24h) | $12.77M | Short sellers largely unaffected |
| Top Trader L/S Ratio (Accounts) | 1.92 | Large players firmly net long |
| Top Trader L/S Ratio (Positions) | 1.59 | Still net long on position sizing |
What Analysts Are Watching For The Rest Of July
Analyst Michaël van de Poppe argued nothing has technically changed for Bitcoin despite the pullback, describing current price as consolidation before a strong run and maintaining his view that the $65,000 breakout earlier in the week remains the key reference point.
Ali Charts added a longer timeframe perspective, noting Bitcoin has historically bottomed roughly 12 months after major market tops and flagging October as the window where the next potential floor could form if that pattern holds in 2026.
Bitcoin Price Prediction: Upside and Downside Targets
- Upside case: The Bollinger midline at $62,578 holds, ETF inflows extend into next week, and BTC makes a third attempt at $65,000 with the July seasonal average providing a tailwind toward the Bollinger upper band at $66,082.
- Downside case: The 20-day EMA at $63,219 and Bollinger midline both fail as support, BTC retests the lower Bollinger Band at $59,075, and the double rejection at $65,000 marks the high for the month as July 2026 joins the short list of negative Julys.
Disclaimer: The information presented in this article is for informational and educational purposes only. The article does not constitute financial advice or advice of any kind. Coin Edition is not responsible for any losses incurred as a result of the utilization of content, products, or services mentioned. Readers are advised to exercise caution before taking any action related to the company.