



- Coinbase places near-term support at 80K-82K, with 73K-75K next if it fails.
- Positive gamma near $80K may dampen moves but does not prove spot demand.
- Binance BTCUSDT open interest eased from a recent four-hour reading near 94,600 BTC.
Bitcoin’s $80,000 floor is approaching a policy test, but the calm around it may be misleading. The latest Binance spot quote was around $80,276 on October 26, while the supplied four-hour chart shows a recent low near $79,281. With the Federal Reserve due to announce its decision on October 28, traders need to distinguish genuine spot buying from stabilization caused by options hedging.
Why Bitcoin’s $80K Support Remains Vulnerable
Coinbase Institutional’s October 23 research put Bitcoin’s one-month implied volatility near 35%, among the lowest readings since 2019, while 30-day realized volatility stood near. It estimated that options dealers’ net long-gamma exposure had reached its highest level since August 22, concentrated around the $80,000 strike.
Dealers holding positive gamma generally buy as prices fall and sell as prices rise to hedge their positions. That activity can soften moves around a major strike. An October 26 gamma chart also showed a positive-gamma regime, with its estimated gamma flip near $79,300. These models are estimates; they do not prove dealers will defend $80,000.If spot loses the estimated gamma flip, hedging may become less stabilizing and intraday swings could widen, although levels vary by model.
Quiet trading does not prove strong spot demand. If dealer rebalancing keeps prices near $80,000, the floor could weaken as positioning shifts or a macroeconomic surprise triggers larger trades.
Bitcoin Faces Key Liquidity Tests Around $80K
Glassnode’s daily-resolution drawdown chart provides long-term context, not a current daily-candlestick setup. It shows Bitcoin roughly 35% below its all-time high, placing the consolidation within a wider correction. A daily close and failed reclaim would offer clearer evidence of seller control than an intraday dip.
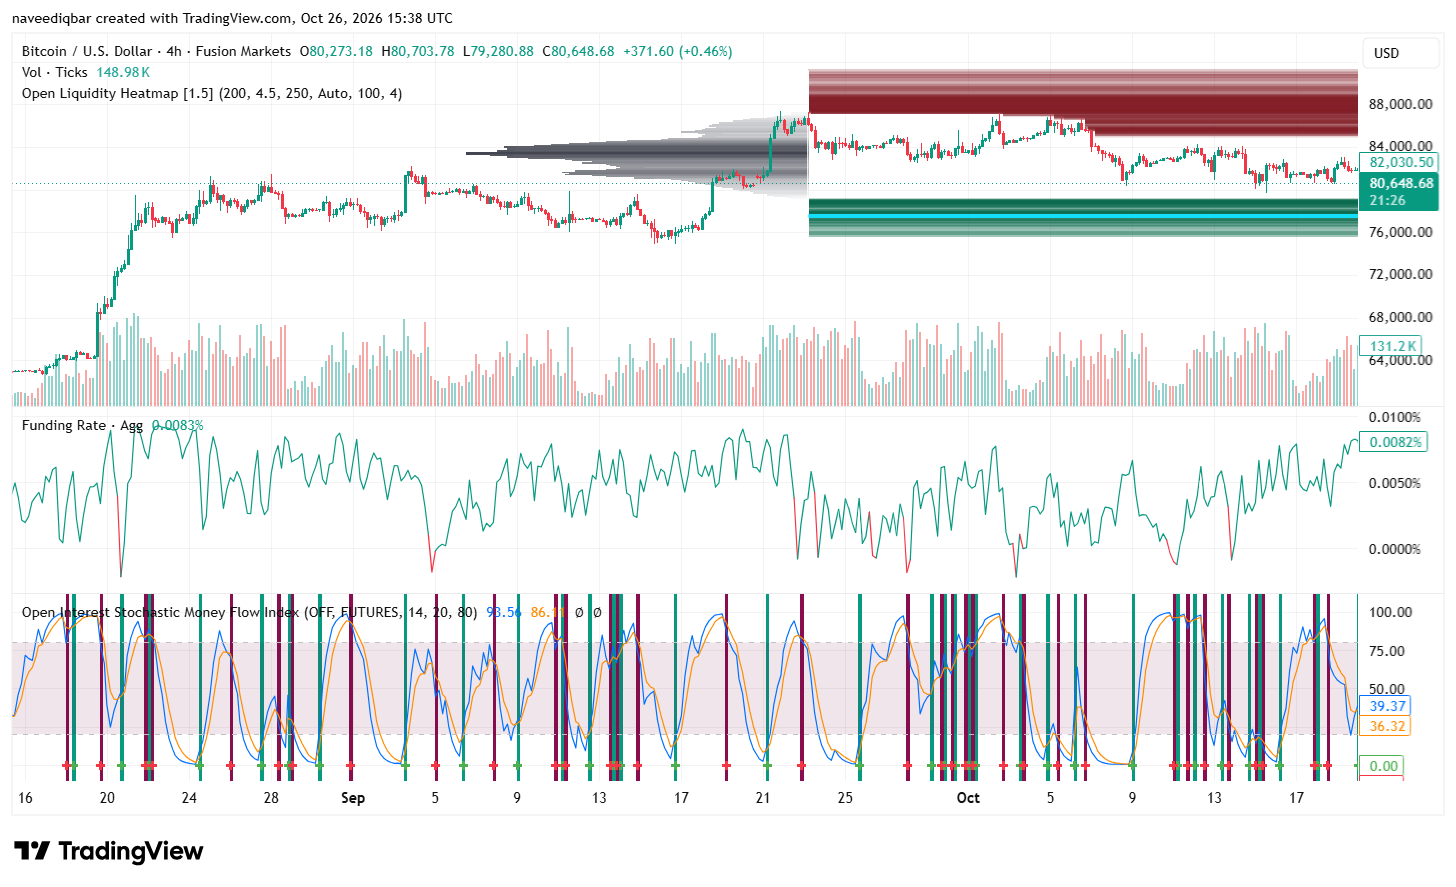
Source: TradingView
Separately, the four-hour chart shows BTC retreating from the mid-$80,000s toward $80,000. Its liquidity heatmap marks potential overhead liquidity around 86,000-90,000, with another band below price around 76,000-80,000. These are monitoring zones, not guaranteed targets.
Funding on the chart is positive at 0.0082%, meaning longs pay shorts. Binance’s latest BTCUSDT perpetual chart showed funding at 0.01% per eight hours and open interest near 93,600 BTC, below a recent four-hour reading of about 94,600 BTC. That suggests some futures exposure has unwound, although the figures cover Binance’s contract rather than the entire market.
Bitcoin Needs Stronger Buying to Sustain a Rebound
A constructive scenario starts with Bitcoin reclaiming 81,300-$ 81,700, where Coinbase places the US spot ETF holders’ cost basis and the 50-day moving average. A stronger four-hour structure would require higher lows and a move through 84,000-85,000. A daily close above $90,000 would more firmly confirm that price has cleared a major overhead supply zone.
Spot demand must support that move. Coinbase reported that US spot ETFs attracted about $6.4 billion since August, compared with roughly $1.5 billion in corporate-treasury buying. However, the seven-day Coinbase premium remained negative throughout October, suggesting US spot buyers outside ETFs were less willing to pay higher prices. Broader ETF inflows, a positive premium, and rising spot volume would make recovery more credible than a futures-led bounce
Bitcoin Traders Brace for the October 28 Fed Decision
Meanwhile, the Federal Reserve’s October 27-28 meeting is the main near-term catalyst. Its official FOMC calendar and policy information confirm the dates. A hawkish statement could lift Treasury yields and the dollar, tightening financial conditions and weighing on Bitcoin. A softer message could ease pressure, but would not replace spot demand. Even an unchanged rate would not guarantee a rally if officials stress persistent inflation.
Coinbase’s October 23 report said futures priced in nearly an 80% chance of a December rate hike. Bitcoin remains sensitive to changes in the Fed’s inflation outlook and borrowing-cost expectations. A daily close below $80,000 followed by a failed reclaim of the 80,000-82,000 band would invalidate the view that this zone remains a durable floor, shifting attention toward Coinbase’s 73,000-75,000 support area.
Related: Bitcoin and the 2026 Midterms: What If Trump Loses Control of Congress?
Disclaimer: The information presented in this article is for informational and educational purposes only. The article does not constitute financial advice or advice of any kind. Coin Edition is not responsible for any losses incurred as a result of the utilization of content, products, or services mentioned. Readers are advised to exercise caution before taking any action related to the company.