


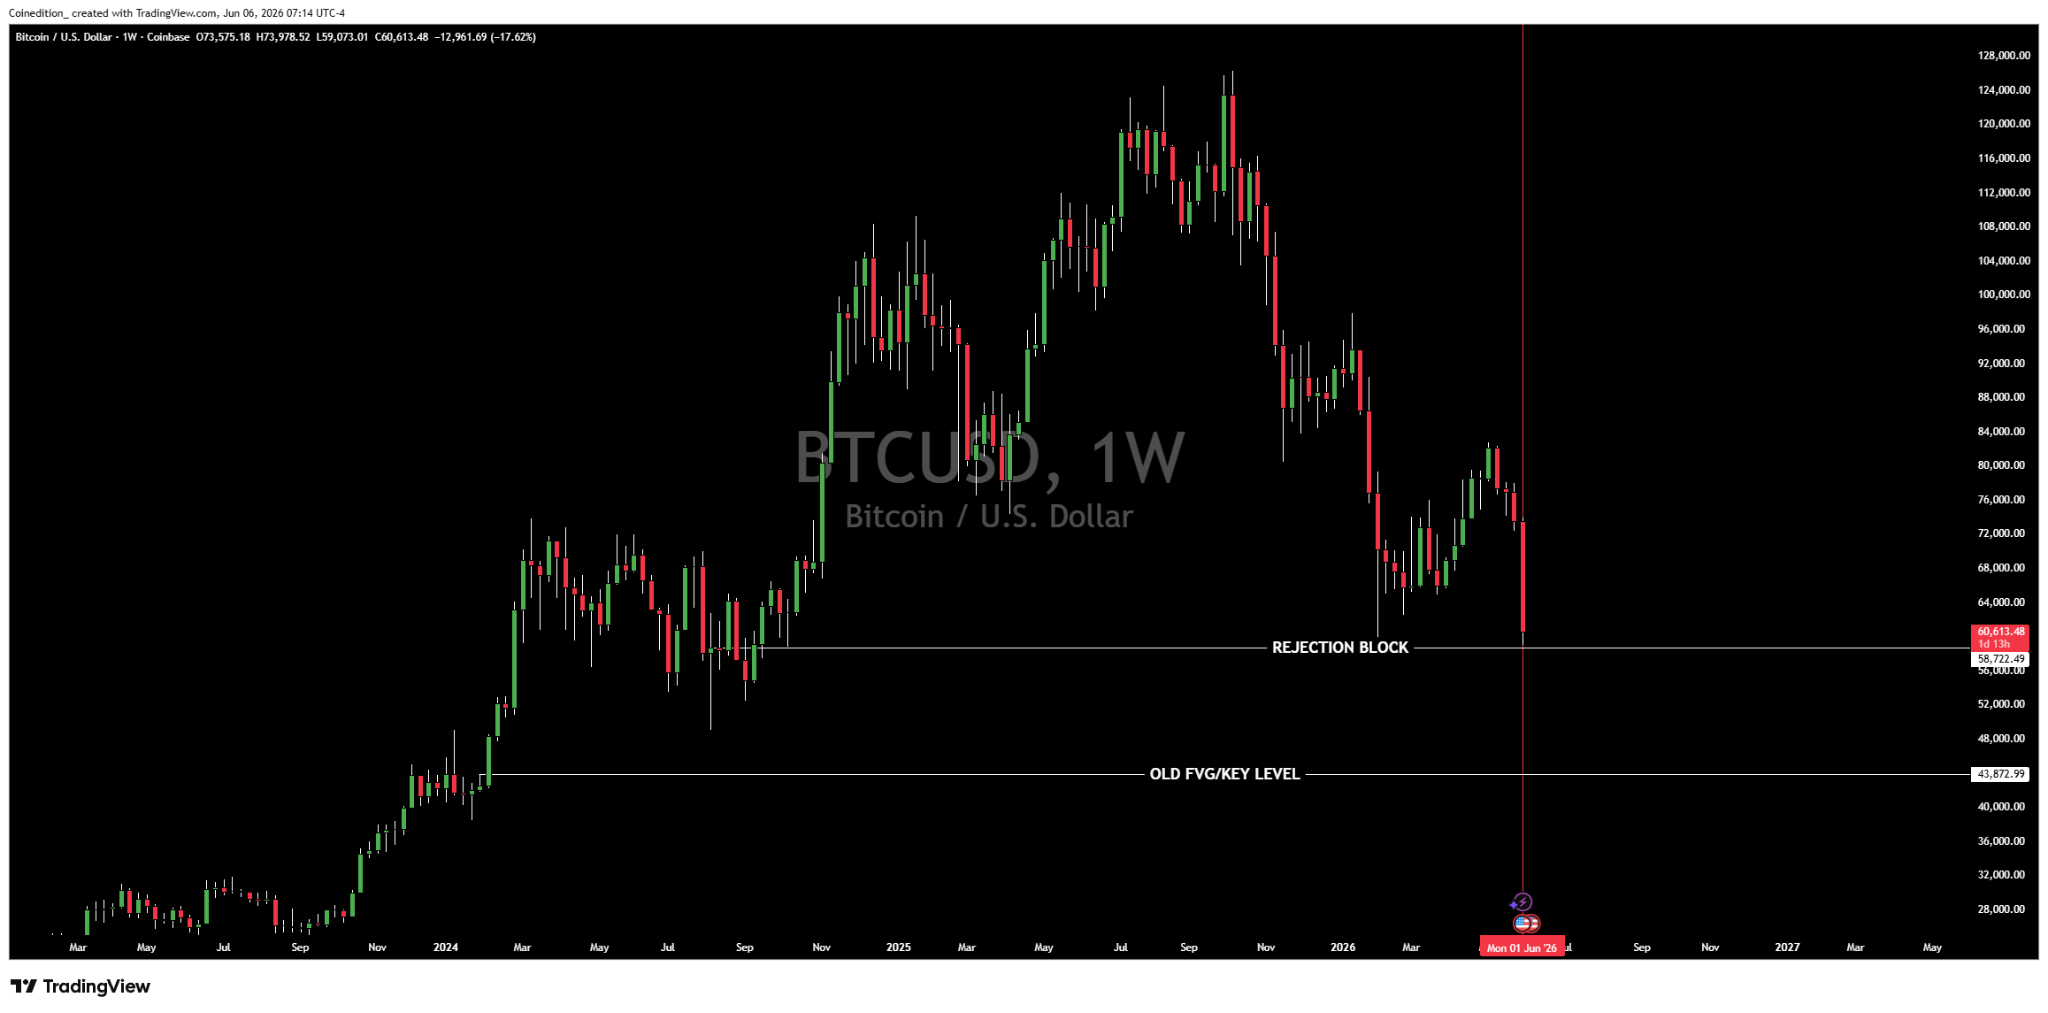
- Bitcoin’s Q2 selloff has returned the token’s price to the 2024 Q3 rejection block.
- The RSI capitulation shows heavy selling pressure, but not a confirmed reversal.
- MVRV bands place Bitcoin’s next major support between $54,000 and $50,000.
Bitcoin entered the final month of Q2 under heavy pressure, with its weekly chart showing a sharp drop toward the 2024 Q3 rejection block. The move placed BTC’s price near the $58,722 area after a steep weekly candle from above $73,000.
BTC was last shown near $60,613, down 17.62% on the weekly Coinbase chart. The decline has shifted attention to whether the current move is a liquidity sweep before recovery or a breakdown toward the old fair value gap near $43,872.
Q3 2024 Rejection Block Returns as Key Test
The chart marks the rejection block around the high-$50,000 region, an area that previously acted as resistance before the 2024 rally expanded. Price has now returned to that zone after failing to hold the $70,000 to $80,000 range.
Source: CoinEdition
This area matters because previous rejection zones often become important retest levels after a major advance. A strong reaction from this region would mirror the 2024 structure, when BTC consolidated before pushing higher.
However, the weekly candle shows heavy downside momentum. The long red body indicates sellers controlled the move into the level, leaving little evidence of immediate strength on the chart.
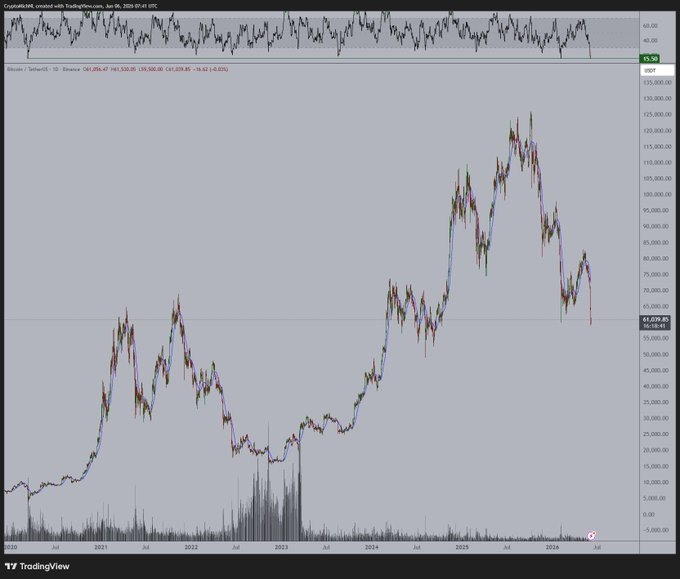
RSI Shows Capitulation Pressure
The second chart adds a momentum warning. Michaël van de Poppe said the daily RSI on Bitcoin reached its lowest level since the COVID-19 crash.
Source: X
That reading reflects extreme selling pressure, not an automatic reversal signal. Oversold conditions can persist during capitulation phases, especially when the token’s price continues sweeping liquidity below obvious support zones.
The chart also shows BTC breaking sharply from the recent rebound area near $70,000. That move pushed Bitcoin’s price back toward a broader support band that has defined the current market structure.
MVRV Bands Point to Deeper Support
Meanwhile, Ali Charts said the breakdown below $72,000 placed Bitcoin in a vulnerable position. Based on the MVRV pricing bands, he identified the next major support area between $54,000 and $50,000.
The MVRV chart also shows lower bands around $53,909 and $50,726. If those levels fail, the weekly chart’s old FVG and key level near $43,872 become the next visible downside marker.
For now, BTC sits between two major narratives. The rejection block may become the base for another rally, but a clean breach would shift focus toward the older low near $43,800.
Related: Bitcoin Drops 13% as Strategy Sale Fuels Debate Over Treasury Risk
Disclaimer: The information presented in this article is for informational and educational purposes only. The article does not constitute financial advice or advice of any kind. Coin Edition is not responsible for any losses incurred as a result of the utilization of content, products, or services mentioned. Readers are advised to exercise caution before taking any action related to the company.
 Price Prediction 2026-2030: Will TRX Hit $0.50 Soon?")
 Price Prediction 2026-2050: Will HYPE Hit $100 Soon?")


: What Happens If You Use an Unlicensed Platform?")