


- BinaryX is in a downward trajectory in the last 4-hours.
- The BNX/USD pair is testing the $159.5 support level.
- Binary X has been on a firm uptrend in the last 24 hours.
Recent BinaryX price movement shows a bearish flag pattern forming on the BNX/USD pair 1 day chart, suggesting that momentum is starting to fade. This can be seen by BNX prices retracing from the key support level at $159.5. However, BNX remains bullish overall and may see a rebound as strong trading volume indicates sustained market interest in this digital currency.
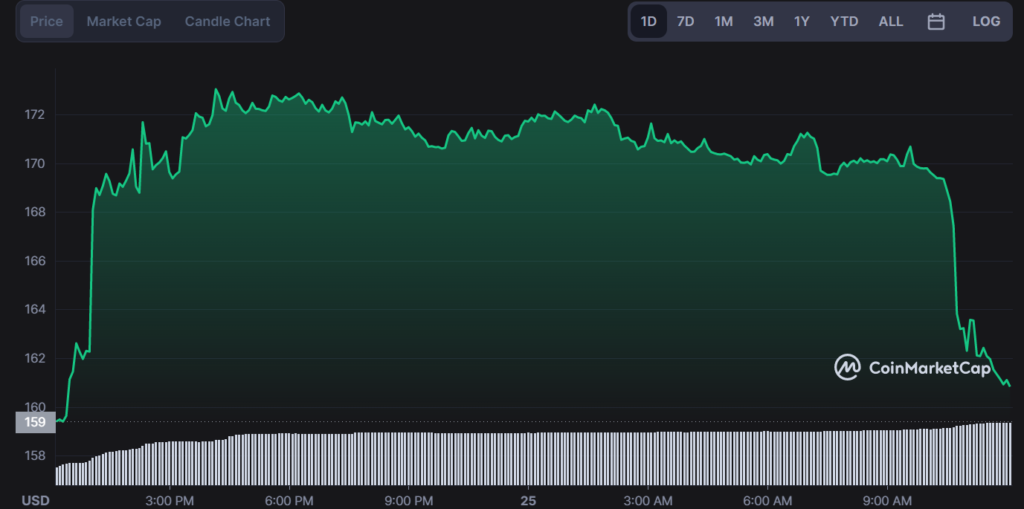
BNX coin is trading at $161.73, with an increase of 0.27% at the press time. BinaryX surged to highs of $173.04 earlier today, supported by strong market momentum. If BNX is able to hold support at $159.5, it could be on track for a bullish reversal in the near term. However, there may be some volatility ahead as BNX prices move closer to key resistance levels of $164 and $166.
The daily RSI is headed downwards, currently residing at 56, indicating BNX is in a string trend. BNX traders should look for support levels at $159 and $155 to confirm a bullish trend reversal. Conversely, BNX could be heading lower if it breaks below support at $149.
The 50 day MA should continue to serve as a strong support level, while BNX bulls will look for the following resistance levels – $164 and $166. If BNX is unable to break these key price hurdles, it may be headed for another retracement in the coming days. The market volatility has been high as bears and bulls fight over BNX prices. The Bollinger bands are expanding which indicate increased volatility, suggesting BNX could be due for a breakout in either direction.
As BNX prices move closer to key support and resistance levels, traders should keep a close eye on BNX trends, as this digital currency may experience significant price swings in the coming days.
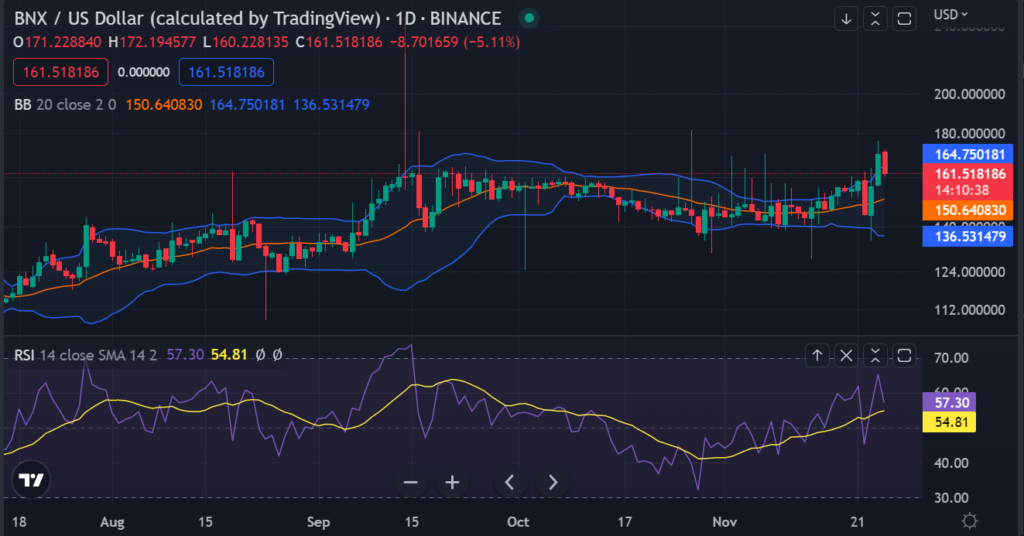
On the 4-hour chart, a bearish flag pattern is developing which could signal a BNX retracement. However, BNX remains bullish overall and may see a bounce as long as it stays above $159.5. BNX traders should watch for support at $159 and $155 to confirm that BNX is heading higher. Conversely, BNX prices could fall if it breaks below support at $149 and enters a downward trend.
Overall, it appears BNX will retrace in the near term before they resume an uptrend. The price fluctuations in recent hours have been relatively high, and BNX traders should be ready for a big move in either direction. As BNX prices approach key support and resistance levels, BNX traders should stay informed on BNX price movements to catch any potential BNX retracement or breakout.
Disclaimer: The views and opinions, as well as all the information shared in this price prediction, are published in good faith. Readers must do their research and due diligence. Any action taken by the reader is strictly at their own risk. Coin Edition and its affiliates will not be held liable for any direct or indirect damage or loss.
Disclaimer: The information presented in this article is for informational and educational purposes only. The article does not constitute financial advice or advice of any kind. Coin Edition is not responsible for any losses incurred as a result of the utilization of content, products, or services mentioned. Readers are advised to exercise caution before taking any action related to the company.


