


- Despite a price decrease, BONK’s market cap flipped over WIF.
- While the AO showed downward momentum, the CVD indicated a possible rise to $0.000039.
- Volatility around WIF decreased, indicating that it might hit $3 in the short term
The ongoing market cap battle between Bonk (BONK) and dogwifhat (WIF) took another turn on March 12. Previously, WIF had surpassed BONK to become the 62nd largest cryptocurrency by market cap.
But as of this writing, BONK flipped the other Solana-based meme coin. Both WIF and BONK surpassed $2 billion in terms of market cap a few days ago. However, at press time data from CoinMarketCap showed that both of them had dropped below the landmark.
While BONK’s market cap was $1.93 billion, WIF was $1.85 billion. One reason the values decline could be linked to their respective price performance. In the last 24 hours, the price of WIF decreased by 12.68%. BONK, on the other hand, lost 5.29% of its value.
The price decline could be linked to profit-taking in the market. Also, it could be a result of capital rotation from memecoins into other categories in the ecosystem
BONK Price Analysis
At press time, the BONK/USD 4-hour chart showed that momentum had become bearish as indicated by the Awesome Oscillator (AO). With the negative AO reading, BONK’s price has the potential to decrease to $0.000026.
However, the Cumulative Volume Delta (CVD) was in the positive region. This implies that there has been more buying volume than sell orders. If this continues to be the case, BONK’s price might rebound.
But one thing Coin Edition noticed was that the CVD stalled. Therefore, the positive value could be a result of the buying pressure experienced since March started. If the CVD rises higher, then BONK might retest $0.000039. If not, the value might decrease.
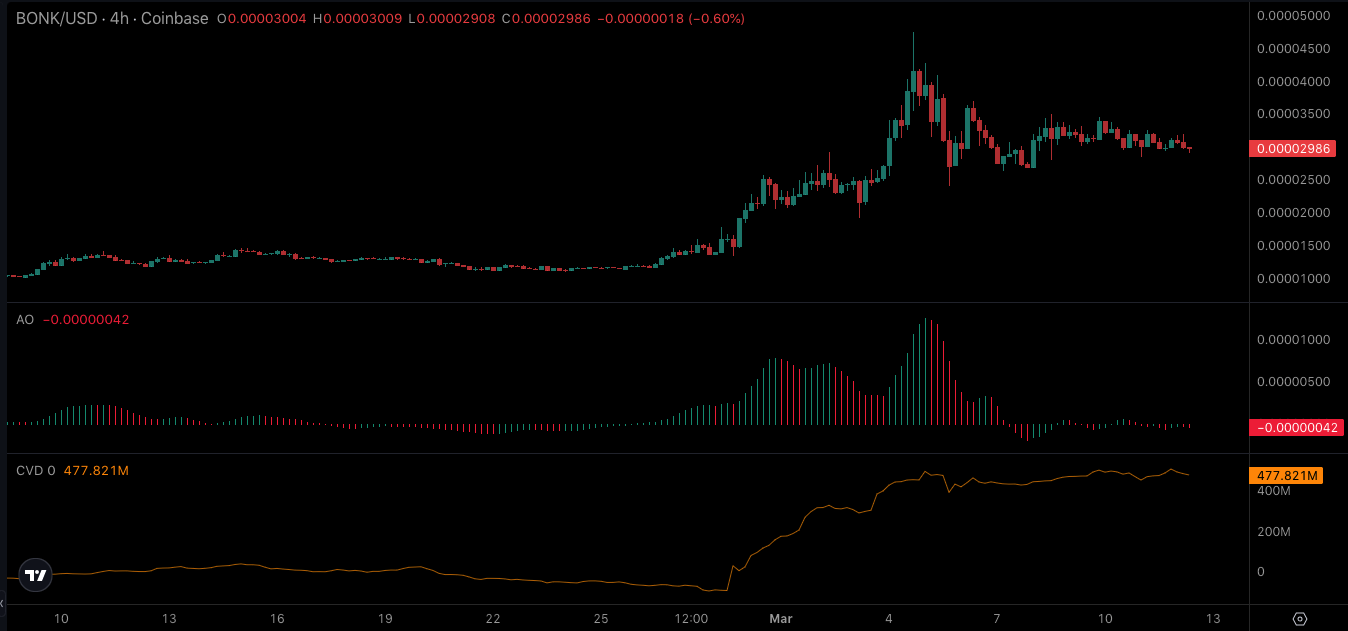
BONK/USD 4-Hour Chart (Source: TradingView)
WIF Price Analysis
Like BONK, WIF’s price fell as the red candlestick forced it down to $1.87. However, WIF might be able to retest $2 because of the indications from the buy/sell volume.
Previously, the buy/sell volume was negative. But with the indicator rising into the green area, WIF could exit the bearish state. Should this be the case, the market cap could once again battle BONK for the 62nd position.
In terms of volatility, the Bollinger Bands (BB) showed that the bands had contracted. As such, it could be difficult to see WIF rise to $3.
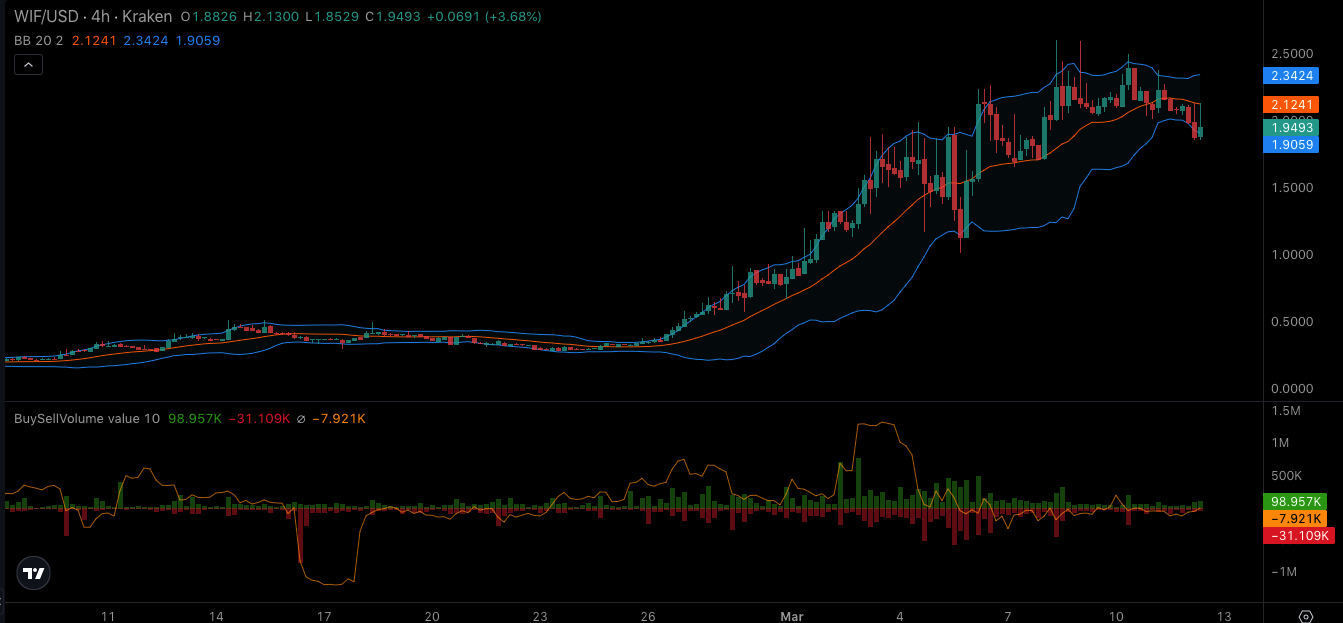
WIF/USD 4-Hour Chart (Source: TradingView)
In a highly bullish case, the price of WIF might hit $2.35. On the other hand, bearish momentum could pull down the price to $1.14.
Disclaimer: The information presented in this article is for informational and educational purposes only. The article does not constitute financial advice or advice of any kind. Coin Edition is not responsible for any losses incurred as a result of the utilization of content, products, or services mentioned. Readers are advised to exercise caution before taking any action related to the company.
Disclaimer: The information presented in this article is for informational and educational purposes only. The article does not constitute financial advice or advice of any kind. Coin Edition is not responsible for any losses incurred as a result of the utilization of content, products, or services mentioned. Readers are advised to exercise caution before taking any action related to the company.


 Price Prediction 2026, 2027, 2028, 2029, 2030-2050")

