
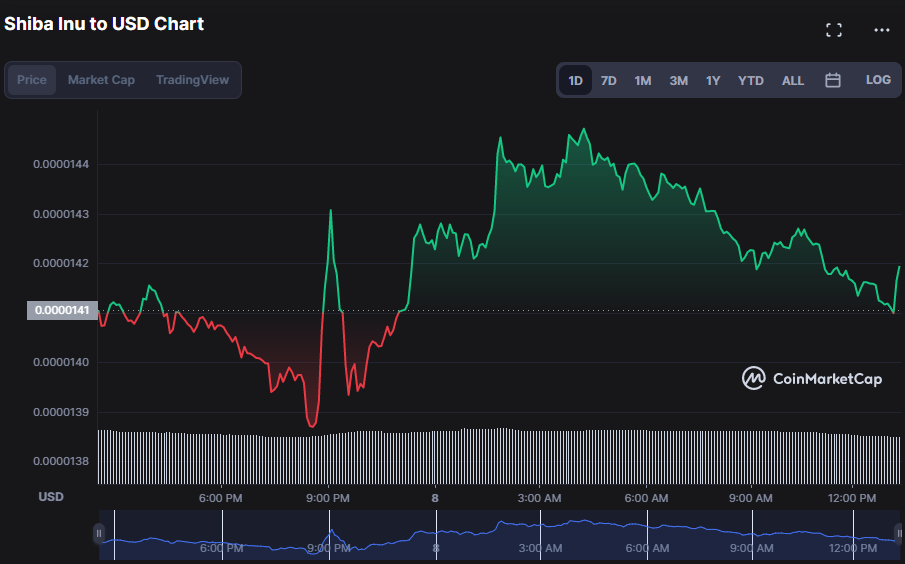
- SHIB price varies between $0.00001387 and $0.00001448 in the previous 24 hours.
- Indicators show that bears are gaining strength, warning traders.
- According to recent research, the SHIB market is on the rise.
After a period of bearish control in the early hours of the day, the Shiba Inu (SHIB) market found support at $0.00001387. Bulls crowded the SHIB market after establishing support, raising the price to an intra-day high of $0.00001448. As of press time, the bullish rebound sent the SHIB price up 0.98% to $0.00001421.
During the upturn, the market capitalization increased by 0.97% to $7,801,731,580, but the 24-hour trading volume decreased by 13.24% to $431,104,436. Despite the drop in trading volume, optimistic traders were able to take advantage and record an intra-day high, giving the market some optimism for additional gains in the coming sessions.
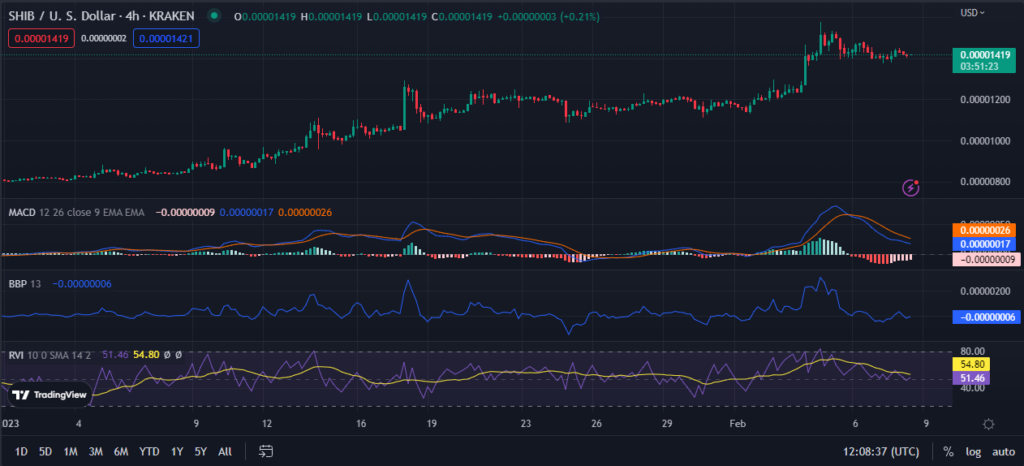
With the MACD blue line crossing below its signal line at 0.00000019, the bullish momentum looks to be fading, and traders should be aware of this market reversal indication. Adding to the SHIB market’s pessimistic notion, the histogram is trending lower as the red bars fall below the zero line, indicating that the sell-off is escalating and bearish pressure is increasing.
Furthermore, the Bull Bear Power (BBP) trend is negative, with a value of -0.00000018, indicating that the bears are gradually gaining market control. As a result, investors should pay attention to these warning indications and be aware that a big market move might come shortly.
The Relative Volatility Index (RVI) reading of 51.46%, which is now below the signal line, reinforces this negative trend.
This shift indicates that a price reversal is possible, and investors should be ready for the market to move in either direction. A turnaround may be imminent, with the Bull Bear Power trend clearly in the negative zone and the Relative Volatility Index falling below the signal line.
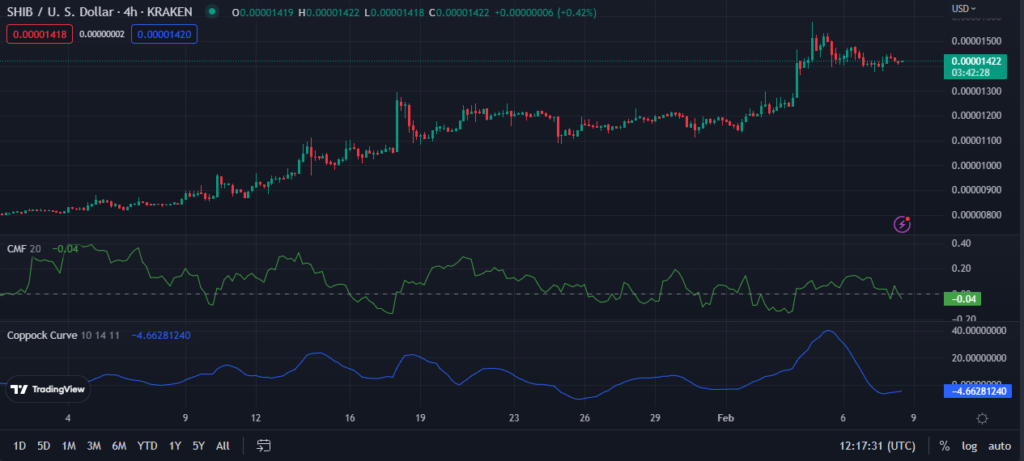
With a value of -0.04, the Chaikin Money Flow (CMF) has recently migrated into the negative zone, indicating that more sellers than buyers have characterized recent trading activity. Given that the CMF implies that money is pouring out of the market, this move predicts a likely market decline.
Last but not least, the Coppock Curve has a reading of -4.66281240, showing that market participants are pessimistic and predicting that the current trend may continue, as pessimism leads to more selling than purchasing.
Technical indications reveal that bears are gaining momentum in the SHIB market, implying that the bullish run may end.
Disclaimer: The views and opinions, as well as all the information shared in this price analysis, are published in good faith. Readers must do their own research and due diligence. Any action taken by the reader is strictly at their own risk, Coin Edition and its affiliates will not be held liable for any direct or indirect damage or loss.
Disclaimer: The information presented in this article is for informational and educational purposes only. The article does not constitute financial advice or advice of any kind. Coin Edition is not responsible for any losses incurred as a result of the utilization of content, products, or services mentioned. Readers are advised to exercise caution before taking any action related to the company.


 Price Prediction: UNI Eyes $5 as UNI Extends Bullish Breakout")
