 Price Leaps by 19.49%")
- As bear power wanes in AXS, prices are being driven higher by bull supremacy.
- Technical indicators state that the current positive trend in the AXS market will continue.
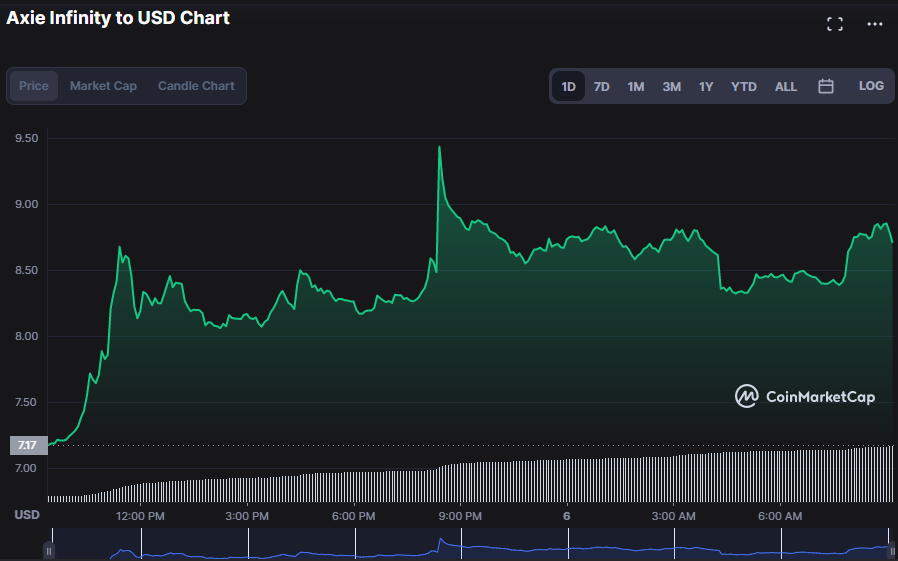
- In the past 24 hours, AXS has encountered resistance at $9.43 and support at $7.82.
Over the past week, bulls in Axie Infinity (AXS) have won, and prices have been steadily going up. The digital currency ran into resistance over the last 24 hours when it reached its intra-week high of $9.43. As of press time, AXS was trading at $8.64, up 19.49% from its intraday low of $7.17, which served as its support level.
In line with this bullish trend, market capitalization and 24-hour trading volume both increased by 21.47% to $855,174,938 and 1083.47% to $713,491,959, respectively. High trading volume suggests that there is buying pressure present, and further bullish momentum is therefore anticipated as investor demand drives the stock to ever-higher prices.
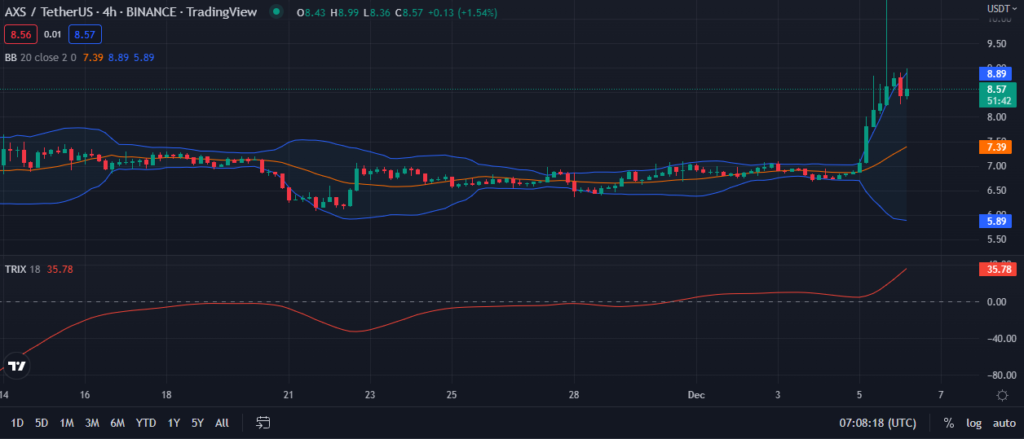
On the 4-hour price chart, a bullish engulfing candlestick is forming, which means that the bullish trend will likely continue for a while. This idea is backed up by the fact that the Bollinger bands are getting wider, which shows that the market is becoming more volatile. In contrast to the lower bands, which touch at 5.88, the top band touches at 8.62. As the price drifts upward, this bullish tendency is further supported.
The TRIX indicator’s score scales from higher to lower, with higher indicating more momentum and lower indicating less momentum. Due to the TRIX reading of 35.78, traders are still confident that bulls will continue to rule the market. As a result of this value being above the zero line and indicating a buy signal, the price of AXS is anticipated to rise.
When the market is trending upward, the Arnaud Legoux moving average (ALMA) moves in the same direction. On the other hand, when both the price and the ALMA are going up at the same time, the price going up above the ALMA warns traders that a breakout or reversal is about to happen. This can be seen on the AXS 4-hour pricing, where the market price of 8.55 is almost higher than ALMA’s reading of 8.57.
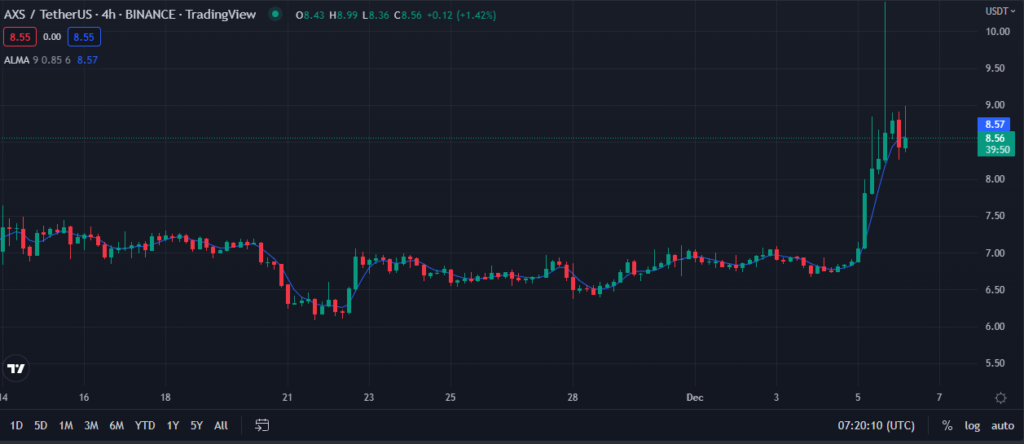
AXS/USD 4-hour price chart (source: TradingView)For the AXS trading pattern to continue moving upward, the bulls must hold the resistance level and raise prices.
Disclaimer: The views and opinions, as well as all the information shared in this price analysis, are published in good faith. Readers must do their own research and due diligence. Any action taken by the reader is strictly at their own risk, Coin Edition and its affiliates will not be held liable for any direct or indirect damage or loss.
Disclaimer: The information presented in this article is for informational and educational purposes only. The article does not constitute financial advice or advice of any kind. Coin Edition is not responsible for any losses incurred as a result of the utilization of content, products, or services mentioned. Readers are advised to exercise caution before taking any action related to the company.
")


