


 and Solana (SOL): Are Major Price Shifts Imminent?")
- Cardano’s volume declined to $1.01 billion while Solana’s value fell from $135.
- The MACD on the 4-hour chart indicated an impeding decline for ADA but the RSI suggested otherwise.
- SOL could swing between $126 and $130 as the short-term EMAs suggested consolidation.
Cardano’s (ADA) trading volume has decreased despite registering a price increase recently. According to CoinMarketCap, the volume was around $1.01 billion at press time. The trading volume is a measure of market interest in a cryptocurrency.
Therefore, an increase could suggest rising interest. But in ADA’s case, the decline implies that buying and selling of the token has reduced as capital seems to be rotating elsewhere.
Like Cardano, Solana (SOL) faced challenges despite its recent impressive performance. In the seven days, SOL’s price has increased by 24.80%. But after getting close to $140, the price reversed, changing hands at $129.32 at press time.
Cardano (ADA)
ADA’s price rose to $0.77, indicating that the decline in volume might not halt its rising price action. However, signals from the Moving Average Convergence Divergence (MACD) seemed to disagree.
A look at the 4-hour ADA/USD chart showed that the MACD was in negative territory. This indicates an imminent bearish momentum. Furthermore, the 12 EMA (blue) and 26 EMA (orange) were around the same point, highlighting how bulls and bears were in a tussle.
Should sellers overcome, ADA’s price might slip below the $0.74 resistance and fall on the $0.65 support. However, a hike in trading volume alongside an increasing value, could trigger ADA’s uptrend in the $0.85 direction.
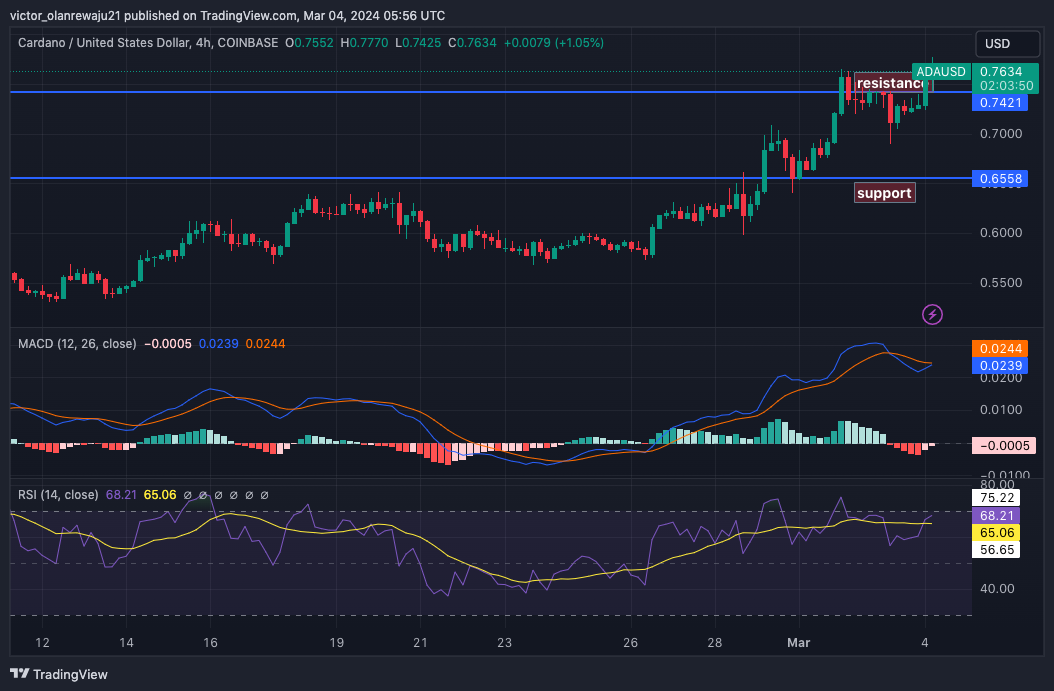
Meanwhile, the Relative Strength Index (RSI) displayed a different outlook from the MACD. At press time, the RSI reading increased, suggesting increased buying momentum.
However, the indicator neared the overbought region. If it taps the overbought zone ADA might retrace. Nevertheless, the price might surpass $0.80 in the short term.
Solana (SOL)
The SOL/USD chart mirrored buyer exhaustion. On March 1, SOL’s price crossed the $135 mark for the first time in a long while. However, the price has not been able to trend any higher as bears seem to be forcing the momentum downward.
Coin Edition then looked at the Exponential Moving Average (EMA). As of this writing, the 9 EMA (blue) and 20 EMA (yellow) closed in on each other, indicating indecisiveness in the trend. Following this position, SOL might consolidate.
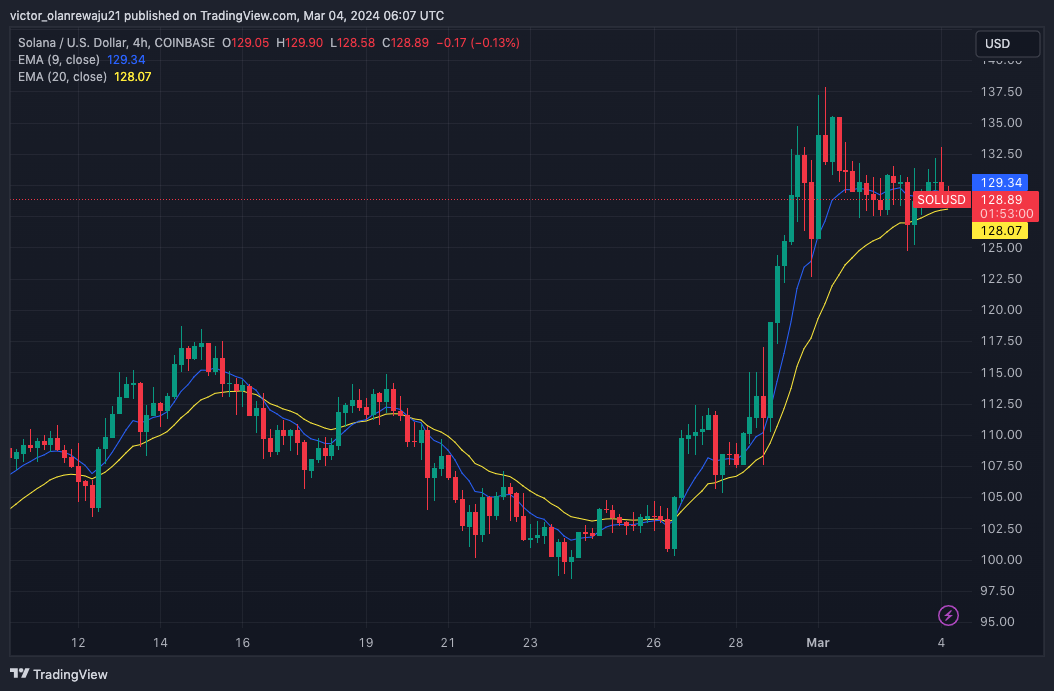
Going forward, the price might swing between $126 and $130. But if the 20 EMA flips the 9 EMA, SOL might fall below $125. However, a bullish crossover where the 9 EMA outpaces the 20 EMA could drive the token toward $150.
Disclaimer: The information presented in this article is for informational and educational purposes only. The article does not constitute financial advice or advice of any kind. Coin Edition is not responsible for any losses incurred as a result of the utilization of content, products, or services mentioned. Readers are advised to exercise caution before taking any action related to the company.


 Price Prediction 2026, 2027, 2028, 2029, 2030-2050")

