


- ADA broke above major EMAs but faces strong resistance near $0.270 zone momentum test
- Open interest cooled after $1B surge, showing reduced leverage and caution signals
- Spot outflows persist, limiting upside despite consolidation above key support zone
Cardano extended its recovery this week after breaking above a key consolidation range on the four-hour chart. The move shifted short-term sentiment firmly in favor of buyers.
ADA now trades above its major exponential moving averages, signaling improving momentum despite recent signs of cooling near resistance. Traders continue watching whether the token can sustain its breakout structure as broader cryptocurrency markets stabilize.
ADA Breakout Faces Key Test Near Resistance
ADA surged from roughly $0.245 to nearly $0.270 during a strong impulsive rally. Consequently, bullish momentum pushed the asset above the 20, 50, 100, and 200 EMAs. That alignment often reflects strengthening trend conditions and growing buyer confidence.
However, recent candles suggest traders have started locking in profits near the $0.268 to $0.270 resistance region. That area also represents an important psychological barrier for short-term market participants. Besides, momentum indicators now point toward consolidation instead of another immediate expansion higher.
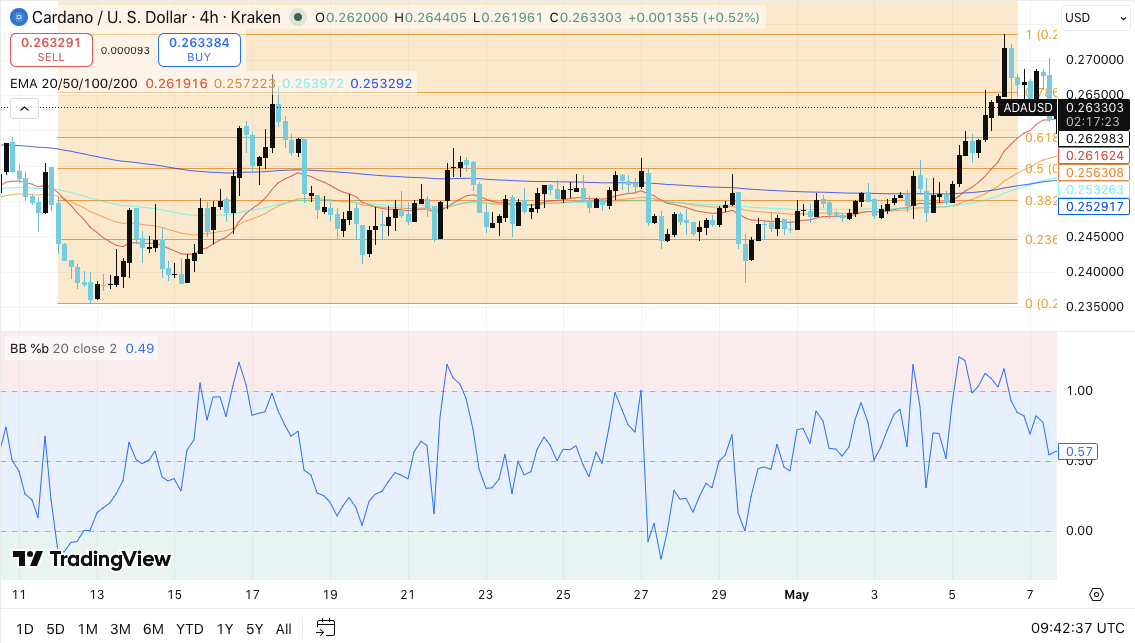
The Bollinger Band %B indicator currently sits near 0.57, showing that ADA still holds positive momentum without entering overextended territory. Hence, analysts expect price action to remain range-bound unless fresh buying volume enters the market.
Related: XRP Price Prediction: Tight Range Forms Near $1.38 Ahead of Breakout
If bulls maintain control above the $0.262 support region, ADA could attempt another breakout toward $0.275 and $0.280. A successful move beyond those levels may open the path toward the broader macro resistance near $0.300.
On the downside, losing the $0.262 zone could weaken the current structure. Consequently, sellers may push the asset back toward $0.258 and potentially $0.252. A breakdown below $0.252 would likely invalidate the recent bullish breakout and revive bearish pressure.
Open Interest and Spot Flows Signal Caution
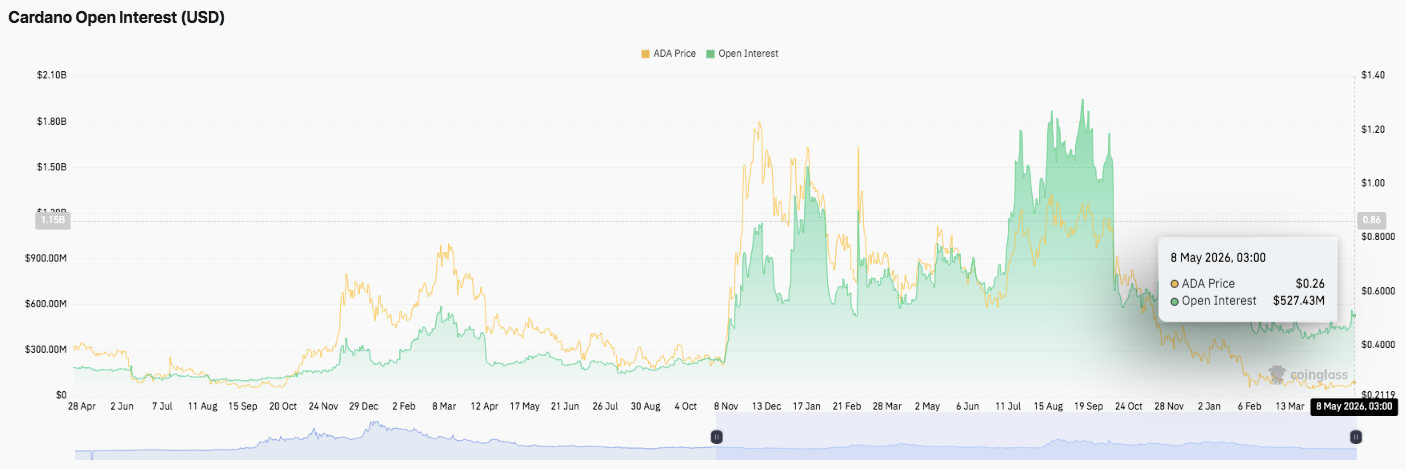
Derivatives data also reflects changing trader behavior. Open interest previously surged above $1 billion during major ADA rallies before eventually peaking near $1.9 billion.
However, declining prices later triggered reduced leveraged exposure and widespread profit-taking.Recent figures show stabilization around $527 million, signaling cautious positioning rather than aggressive speculation.
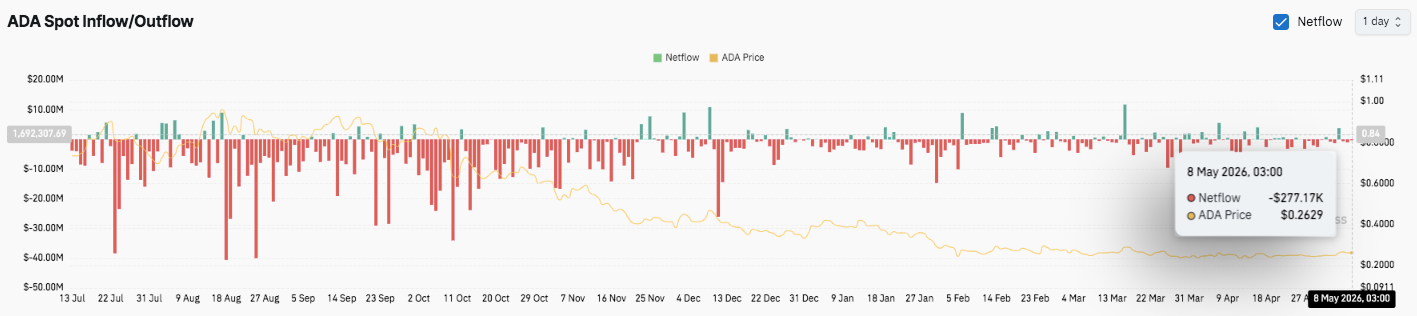
Meanwhile, spot flow data continues showing extended outflow dominance across recent months. Although occasional inflow spikes emerged, they failed to reverse broader selling pressure.
Related: Ethereum Price Prediction: Bitmine Is 6 Weeks From Its ETH Goal and May Stop Buying
Technical Outlook For Cardano Price
Key ADA levels remain firmly in focus as traders monitor whether the recent breakout can sustain momentum into the coming sessions.
Upside levels: $0.270 remains the immediate breakout barrier, followed by $0.275 and $0.280. A confirmed move above this resistance cluster could accelerate buying pressure toward the psychological $0.300 level.
Downside levels: $0.262 serves as the first support zone and breakout retest area. Below that, $0.258 and $0.252 remain critical defensive levels for bulls. A deeper decline could expose ADA to the previous consolidation floor near $0.245.
Resistance ceiling: The $0.275–$0.280 range now represents the key supply zone. ADA must reclaim and hold above this area to strengthen medium-term bullish momentum.
The technical structure suggests ADA is transitioning from consolidation into an expansion phase after reclaiming all major EMAs on the 4H chart. However, slowing momentum near $0.270 indicates traders continue locking in profits while waiting for stronger confirmation.
Will Cardano Go Up?
Cardano price prediction now depends on whether buyers can defend the $0.262 breakout zone while building enough momentum to clear $0.270 decisively. Continued stability above the EMA cluster would support the bullish structure and improve the chances of an extension toward $0.280 and $0.300.
Moreover, derivatives data suggests speculative activity has stabilized after months of declining participation. Spot flow trends also show reduced selling intensity, which may indicate the market is entering a healthier consolidation phase.
However, failure to hold $0.262 could weaken short-term sentiment quickly. In that scenario, ADA may revisit $0.258, $0.252, and potentially $0.245 as traders reduce exposure.
Related: Bitcoin Price Prediction: Tom Lee Says One Monthly Close Ends the Bear Market for Good
For now, Cardano remains in a critical transition zone. Bulls maintain control structurally, but volume confirmation and sustained inflows will determine whether ADA can deliver another breakout leg.
Disclaimer: The information presented in this article is for informational and educational purposes only. The article does not constitute financial advice or advice of any kind. Coin Edition is not responsible for any losses incurred as a result of the utilization of content, products, or services mentioned. Readers are advised to exercise caution before taking any action related to the company.


