


- Crypto Analyst predicts that EGLD could hit $460; however, he warned that it could be risky for long position traders.
- Bulls support EGLD reaching higher; however, they find it difficult to push EGLD to the green zone.
- EGLD has touched the upper BB band while the RSI is at 58.76.
Crypto Rover, a technical crypto analyst, and enthusiast tweeted that it would be risky for traders to open a long position with Elrond (EGLD), citing the tanking prices inside a bullish falling wedge. However, he stated that if his bullish prediction of EGLD hitting $460 were to play out, traders would be rewarded.
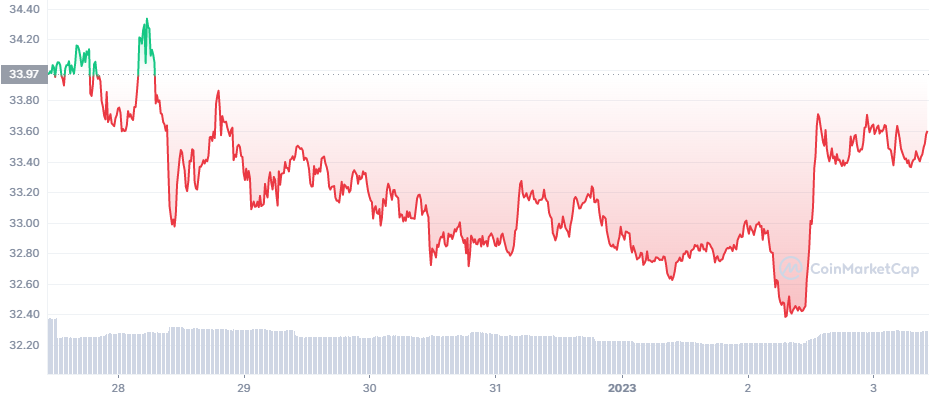
EGLD opened the market for the week, trading at $33.97, as shown in the chart below. On December 28, EGLD fluctuated in the green and red zone equally. However, on the same day, EGLD hit a maximum of $34.32. After reaching its maximum, EGLD entered the red zone, reaching lower lows gradually.
During its descent deep into the red zone, EGLD tanked to its lowest of $32.39. Although the bulls did not have enough momentum to push EGLD past the red zone, they were able to catapult EGLD from $32.43 to $33.69 within a couple of hours. As of press time, EGLD is up 3.56% in the last 24 hours and is trading at $33.57.
As shown in the chart below, EGLD traded in a falling bullish wedge from mid-September up until early October 2022. Just after EGLD broke from the falling bullish wedge, it gained enough momentum to break the 200-day MA and kept rebounding on it.
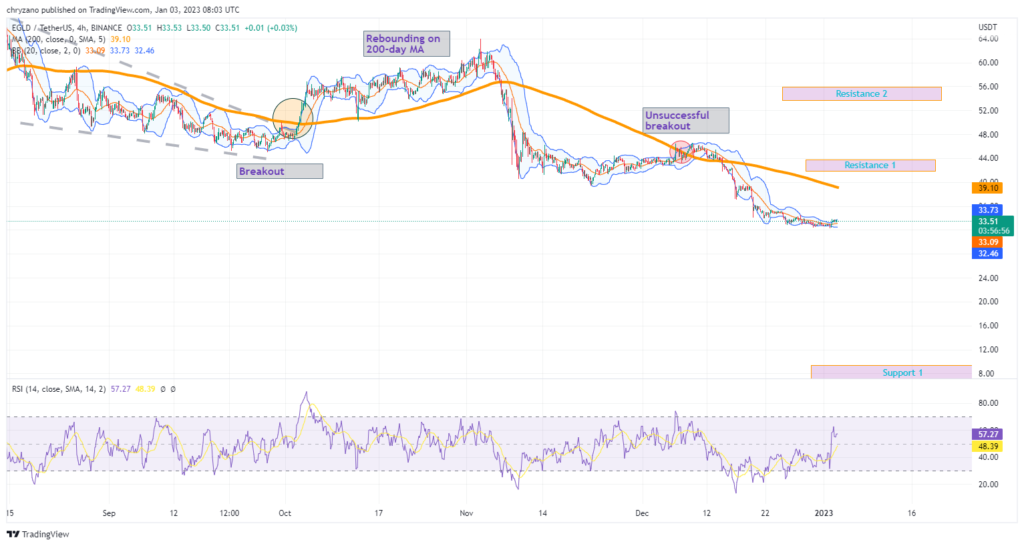
Since its breakout in early October, EGLD wasn’t able to break out of the 200-day MA. EGLD finally tested the 200-day MA in December. However, it resulted in a failure as EGLD fell below the 200-day MA instantly after it broke through.
EGLD has touched the upper Bollinger, and the market could correct the prices. The RSI is at 58.76, which indicates that the trend is well set. If the bulls take control of the market EGLD could reach break its immediate resistance (200-day MA) and then aim at resistance 1. (≈ $42).
Contrastingly, if the bears dominate the market, EGLD could tank to Support 1 ( ≈$8).
Disclaimer: The views and opinions, as well as all the information, shared in this price analysis, are published in good faith. Readers must do their own research and due diligence. Any action taken by the reader is strictly at their own risk, Coin Edition and its affiliates will not be held liable for any direct or indirect damage or loss.
Disclaimer: The information presented in this article is for informational and educational purposes only. The article does not constitute financial advice or advice of any kind. Coin Edition is not responsible for any losses incurred as a result of the utilization of content, products, or services mentioned. Readers are advised to exercise caution before taking any action related to the company.


