


- Activity on Ethereum L2s in 2023 was time 90x what it was during the 2021 bull market.
- If bulls defend the $1.29 support, ARB may rebound in the short term.
- OP can drop as low as $3.34 as selling pressure continues to increase.
According to IntoTheBlock, activity shifted from the Ethereum (ETH) Mainnet to its Layer-two (L2) protocols in 2023. The blockchain intelligence firm, in its post on X, noted that transactions increased on the L2s 90 times compared to what it was in 2021.
Ethereum L2s were developed as a way to solve the scalability issues users face on the main chain. Roughly, the Ethereum Mainnet processes 15 transactions per second. This process also comes with high gas fees.
However, the launch of optimistic rollups including Arbitrum (ARB) and Optimism (OP) meant that users could process transactions with increased speed and reduced costs. The adoption of these L2s has also impacted their respective native tokens.
For example, ARB’s price has risen by 54% in the last 90 days, according to CoinMarketCap. OP also enjoyed a 170% increase within the same period. These performances were one of the reasons Coin Edition tipped OP and ARB as tokens to watch out for in 2024.
Arbitrum (ARB)
After rising as high as $1.64 on December 28, ARB was rejected. This caused the price to drop to $1.44. A look at the 4-hour chart showed that selling pressure has been the order of the days since December 29.
Furthermore, the Aroon indicator showed that another dump could be on the way. This was because the Aroon Up (orange) had flatlined. However, the Aroon Down (blue) had increased to 42.86%.
The trend signals and bearish price action. So, ARB might soon lose hold on the $1.40 region. However, the chart above below that there was support for the token at $1.29. Therefore, if bulls can defend this support, ARB may bounce in the short term.
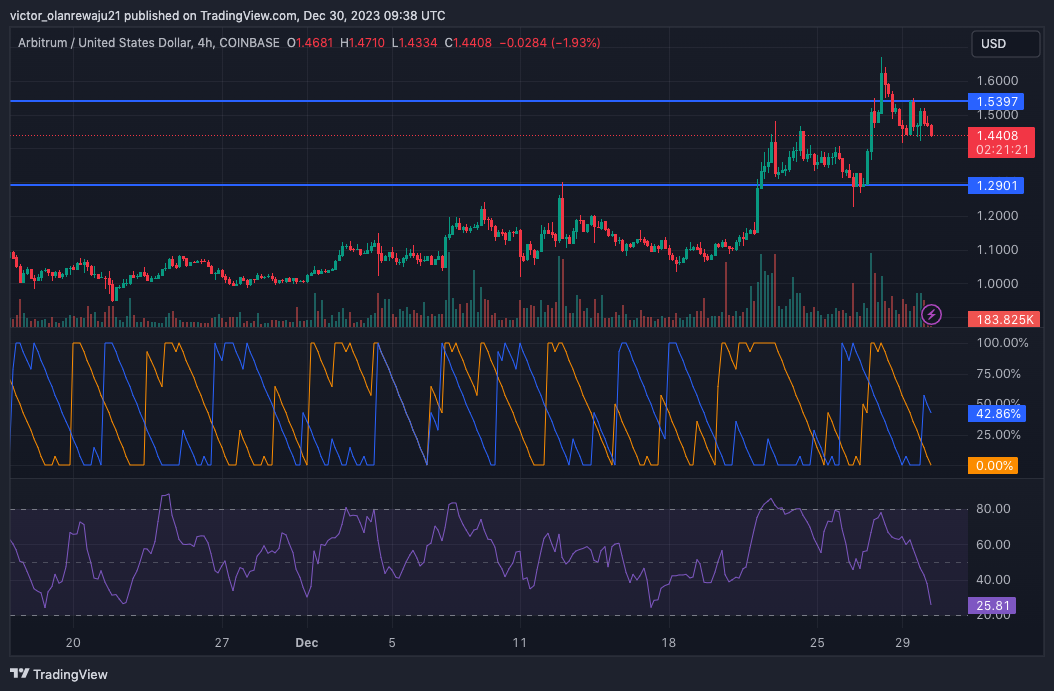
Indications from the Money Flow Index (MFI) showed that ARB was oversold. This position confirmed the notion that the price might reverse upward soon. But before that, a decline could be impending.
Optimism (OP)
As expected, OP’s market structure was similar to ARB’s. At press time, OP’s price was $3.63. In addition, the Bollinger Bands (BB) showed that the cryptocurrency exhibited a high level of volatility.
This implies that there could be significant price fluctuations for the token. If selling pressure increases, OP may drop as low as $3.34. However, a surge in buying pressure could send the cryptocurrency in the $ 4 direction.
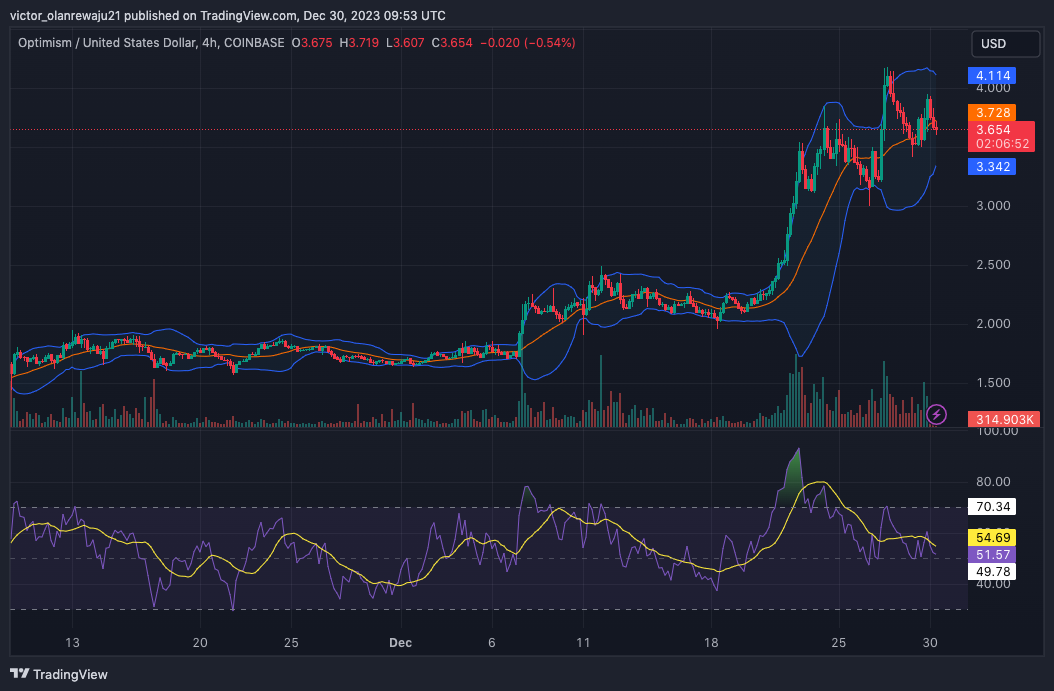
Signals from the RSI, however, showed that buyers did not have much control. So, OP’s might likely move below $3.63 as long as bulls remain onlookers.
Disclaimer: The information presented in this article is for informational and educational purposes only. The article does not constitute financial advice or advice of any kind. Coin Edition is not responsible for any losses incurred as a result of the utilization of content, products, or services mentioned. Readers are advised to exercise caution before taking any action related to the company.


