


- ETH remains bearish after rejection near $2,140 and EMA cluster resistance zone
- Open interest stabilizes near $31–35B as traders reduce leverage exposure levels
- Persistent spot outflows near $35M keep ETH under short-term selling pressure.
Ethereum faced renewed selling pressure after bulls failed to reclaim critical resistance near the $2,140 region. The latest 15-minute chart structure shows weakening momentum as traders reduce risk exposure during continued market uncertainty. Besides, Ethereum’s derivatives and spot market activity both reflect cautious sentiment, adding pressure to short-term price action.
Ethereum Struggles Below Key Resistance Levels
Ethereum attempted a recovery toward the $2,142 resistance zone after bouncing from recent lows. However, sellers quickly regained control and rejected the move near the 0.618 Fibonacci retracement level. Consequently, ETH reversed lower and returned toward the $2,123 support region.
The current structure favors bears as price trades beneath the major EMA cluster. The 20, 50, 100, and 200 EMAs now form a strong resistance barrier between $2,130 and $2,138. Additionally, the Supertrend indicator recently flipped bearish, confirming fading upside momentum.
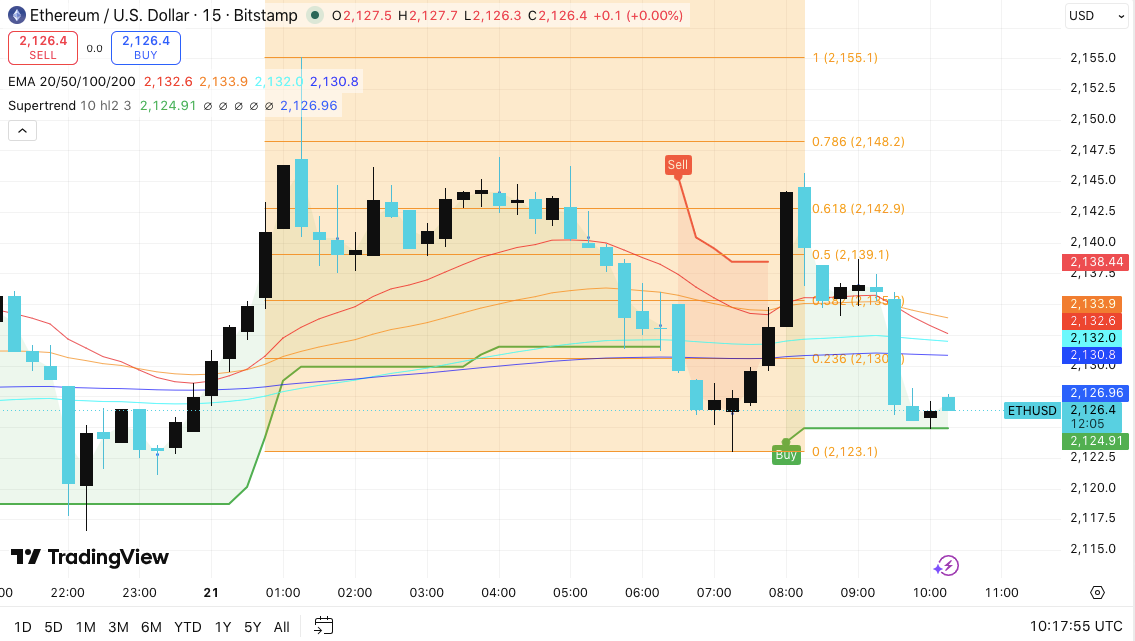
Traders now monitor whether Ethereum can defend the immediate support area between $2,123 and $2,125. A breakdown below $2,120 could trigger another wave of selling pressure. Hence, bears may target the next downside zone near $2,117 if momentum weakens further.
Related: XRP Price Prediction: Polymarket Gives $1.50 Just 6% Odds This Week as Supertrend Flips Bearish
On the upside, Ethereum must reclaim $2,130 to reduce short-term bearish pressure. Moreover, a breakout above $2,139 could reopen the path toward the major resistance cluster between $2,142 and $2,148. Until then, sellers maintain technical control across lower timeframes.
Open Interest Signals Reduced Speculative Activity
Ethereum’s open interest data highlights significant shifts in trader behavior throughout recent market cycles. Earlier this year, open interest expanded rapidly during Ethereum’s rally toward the $4,000 to $4,800 range. That surge reflected aggressive leveraged participation and rising speculative demand.
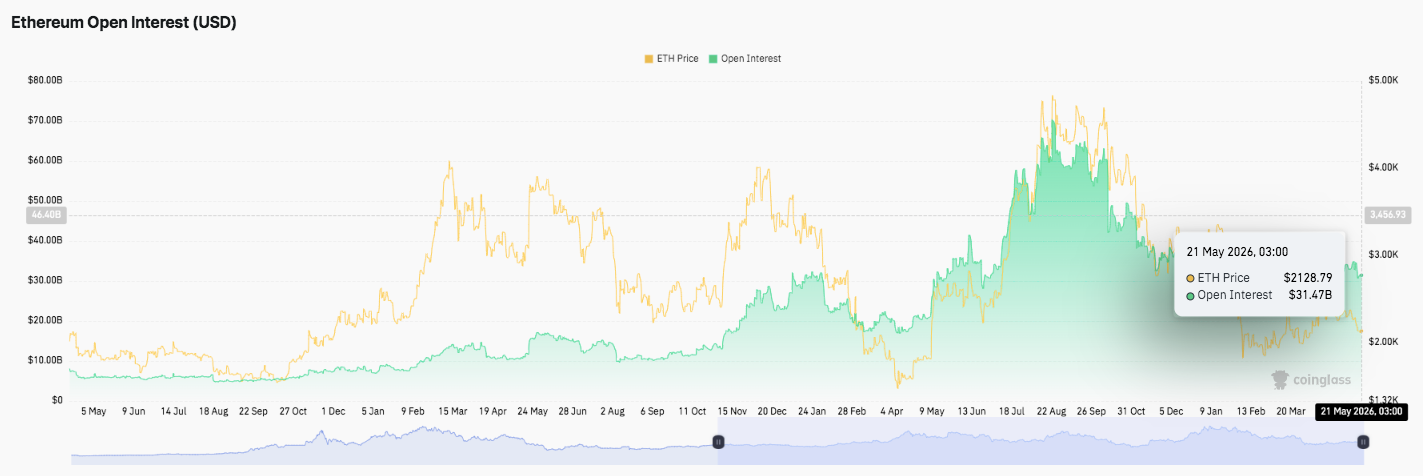
However, market conditions changed sharply after open interest peaked above $60 billion. Traders gradually reduced exposure as Ethereum entered a prolonged correction phase. Consequently, liquidations and profit-taking accelerated across derivatives markets.
Recent data now shows open interest stabilizing between $31 billion and $35 billion while ETH trades near $2,100. This stabilization suggests traders remain cautious and avoid excessive leverage. Additionally, reduced speculative positioning often signals uncertainty about near-term market direction.
Spot Outflows Continue To Pressure ETH
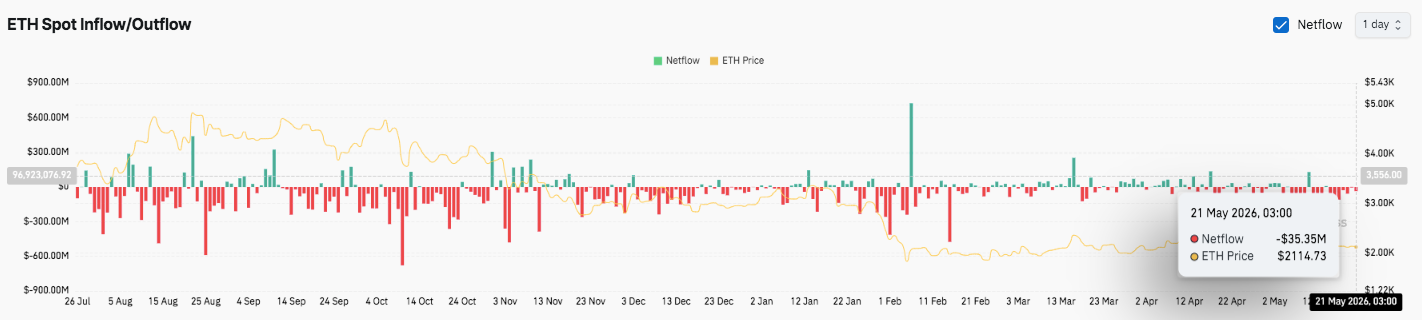
Ethereum spot flow data also reveals persistent market weakness. Outflows continue to dominate inflows across multiple trading sessions, reflecting ongoing sell-side activity. Significantly, several large liquidation spikes appeared during previous correction phases, reinforcing bearish market sentiment.
Related: Shiba Inu Price Prediction: Consolidation Continues as Open Interest Declines and Outflows Dominate
Although occasional inflow bursts emerged, buyers failed to sustain momentum long enough for trend reversals. Price action continues tracking extended periods of negative netflows. Recent readings still show mild outflows near negative $35 million, indicating cautious participation from spot traders.
Technical Outlook For Ethereum Price
Key levels remain critical as Ethereum trades under sustained short-term bearish pressure near the $2,100 region.
Upside levels: $2,130 remains the first recovery barrier, followed by $2,139 near the 0.5 Fibonacci retracement zone. A stronger breakout above $2,142–$2,148 could shift momentum back toward buyers and open the door for a retest of higher resistance zones in the near term.
Downside levels: Immediate support stands between $2,123 and $2,125. Below that, the $2,120 level remains the key breakdown trigger. If sellers force a move beneath that zone, Ethereum could slide toward $2,117 and potentially extend losses deeper into the $2,100 psychological support region.
Resistance ceiling: The EMA cluster between $2,130 and $2,138 currently acts as the primary resistance ceiling. Ethereum must reclaim this area to restore short-term bullish momentum and weaken ongoing bearish pressure.
The broader technical structure shows Ethereum consolidating after repeated rejection from Fibonacci resistance. Besides, weakening open interest and persistent spot outflows continue reflecting cautious trader sentiment and reduced speculative activity.
Will Ethereum Rebound?
Ethereum price prediction now depends heavily on whether bulls can defend the $2,120 support region while rebuilding momentum above the EMA resistance cluster. If buyers regain strength and spot inflows improve, ETH could revisit the $2,142–$2,148 resistance zone and potentially trigger a broader recovery phase.
Related: Dash Price Prediction: DASH Consolidates While Buyers Attempt $50 Breakout Recovery
However, failure to stabilize above $2,120 may strengthen bearish momentum and increase liquidation pressure across derivatives markets. Consequently, ETH could remain vulnerable to deeper downside volatility in the short term.
For now, Ethereum sits at a decisive technical zone where both macro sentiment and short-term liquidity flows will likely determine the next directional move.
Disclaimer: The information presented in this article is for informational and educational purposes only. The article does not constitute financial advice or advice of any kind. Coin Edition is not responsible for any losses incurred as a result of the utilization of content, products, or services mentioned. Readers are advised to exercise caution before taking any action related to the company.


