

- XRP price prediction stays bullish above $1.45, with $1.55 the level to clear for a move toward $2
- XRP spot ETFs logged an 11th straight week of inflows, adding $75.59 million last week
- Longs absorbed $10.68 million of the past 24 hours’ $16.44 million in XRP liquidations
XRP price prediction stays bullish above $1.45, the level XRP is defending after a slide from $1.66 while ETF inflows stretch to an 11th straight week.
XRP Price Analysis: Can XRP Hold Its Triangle Support Near $1.37?
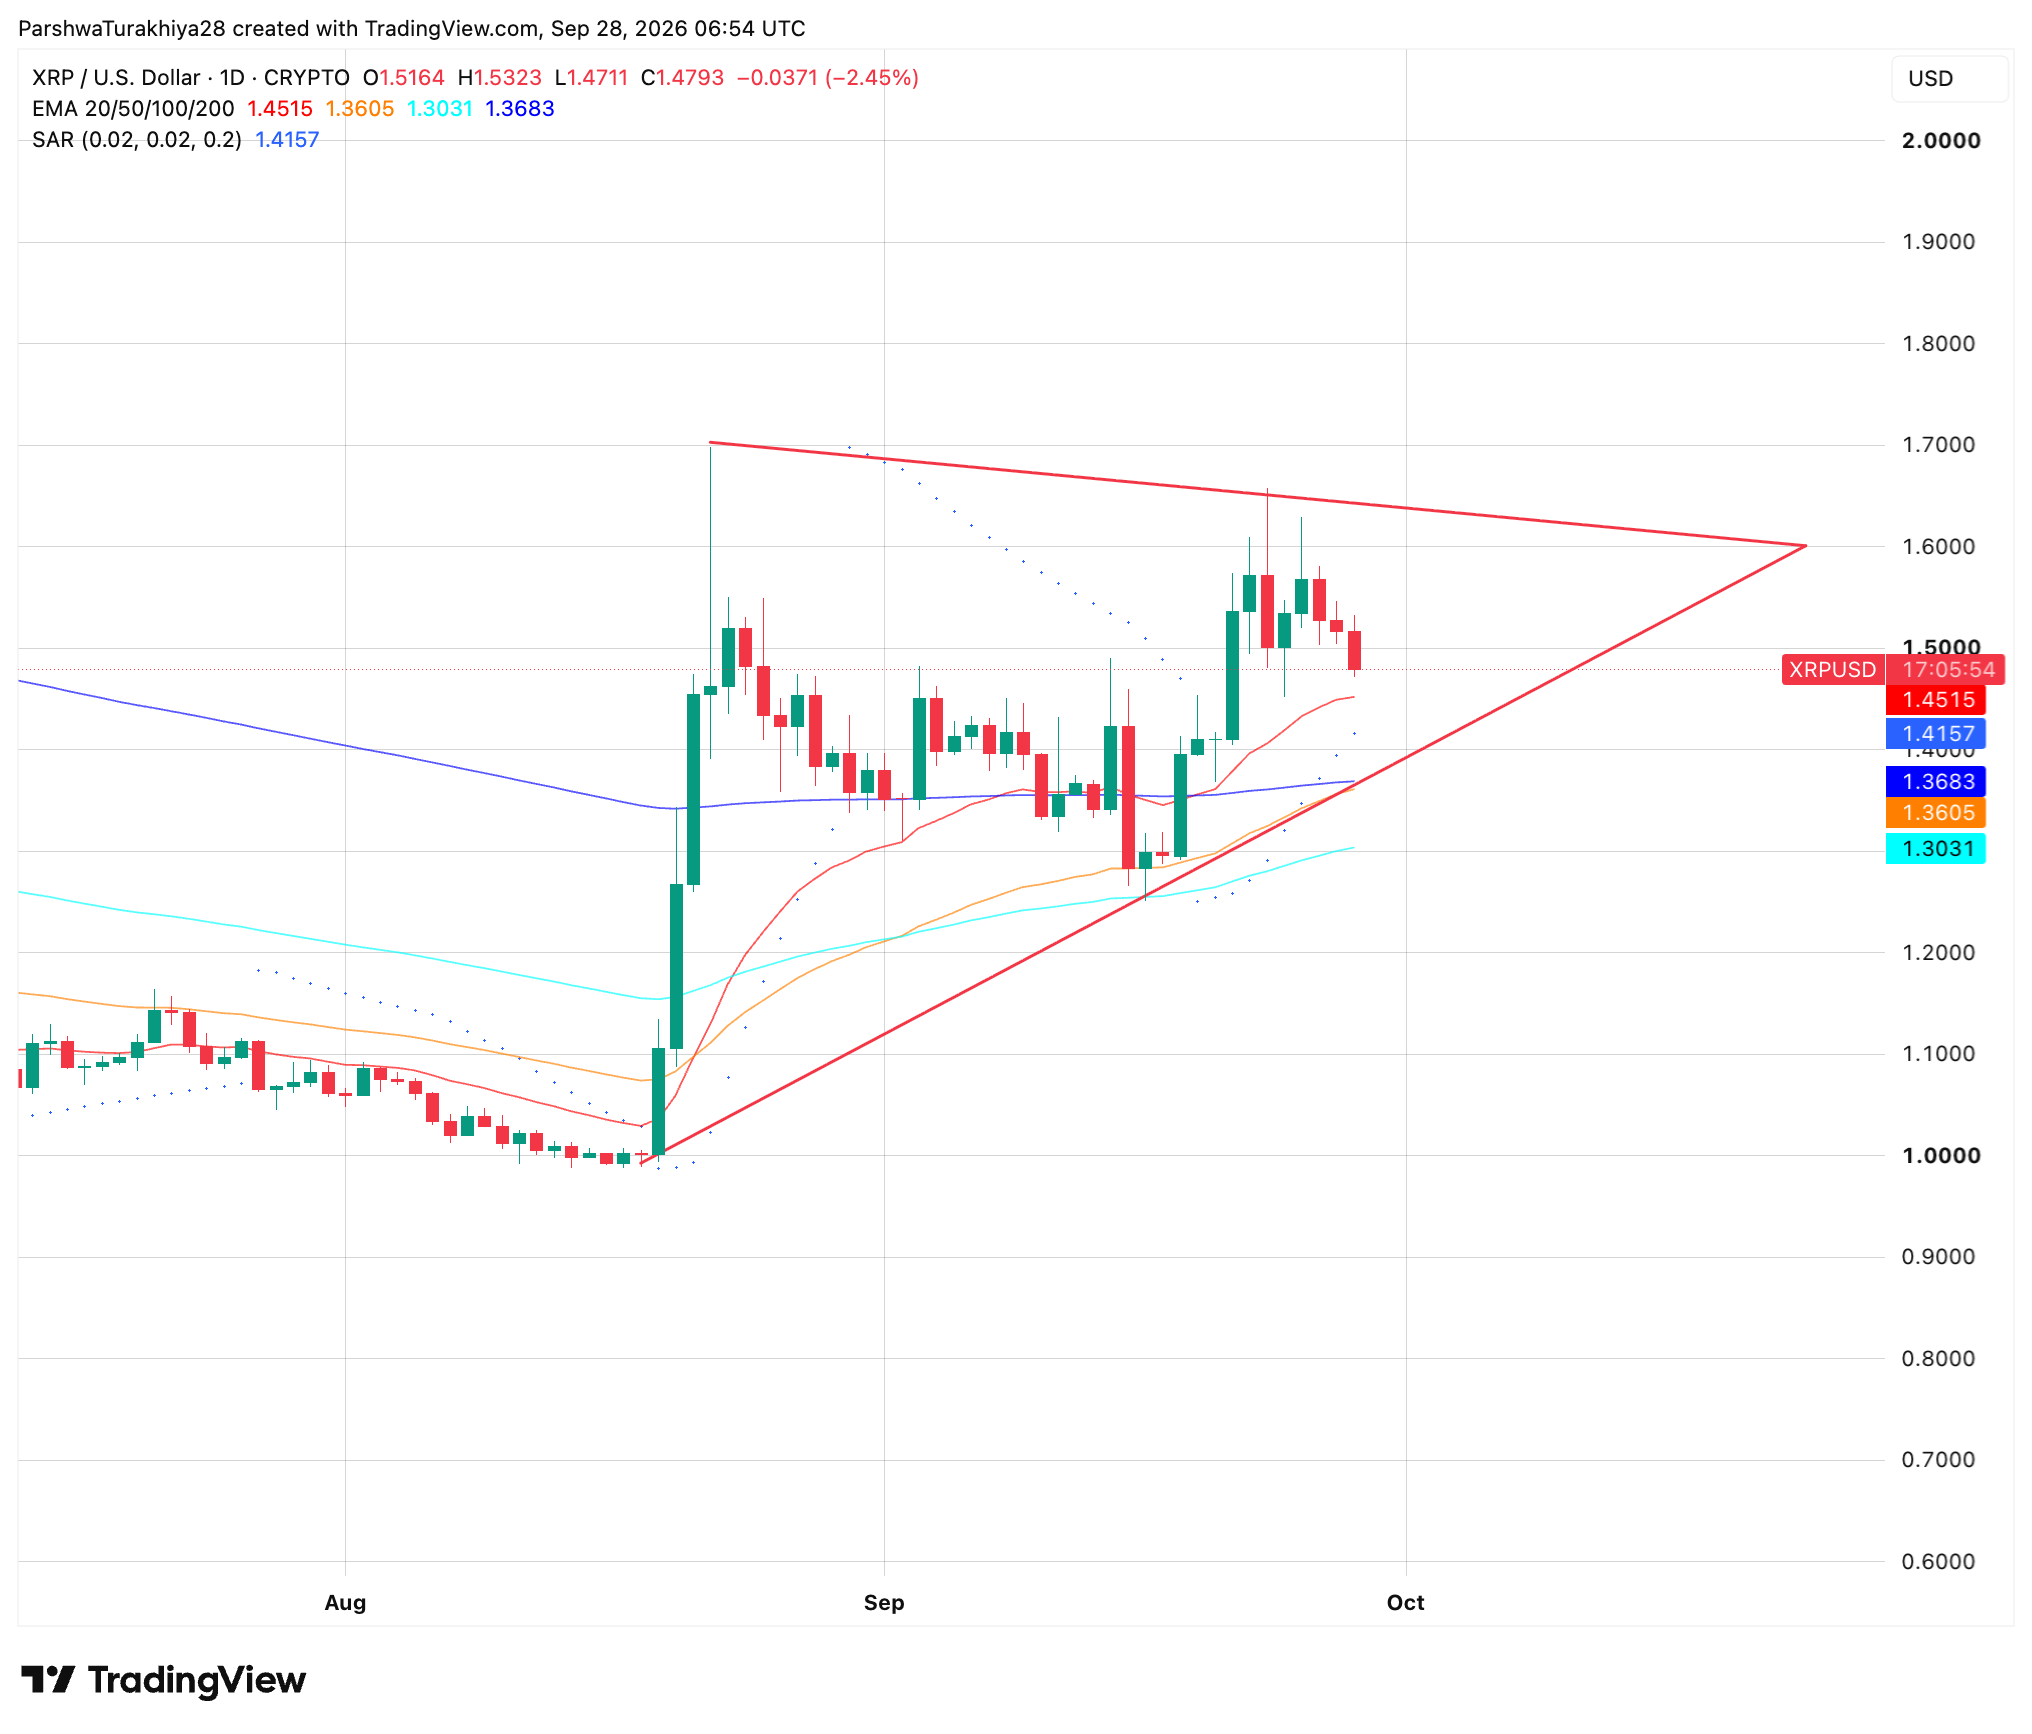
XRP is still holding above that support, trading near $1.4793, down 2.45% today and lower for a third straight session since it hit $1.66 on September 23. That high came at the upper edge of a narrowing triangle that’s been tightening since August, bounded by a falling trendline off the $1.70 August high, now near $1.64, and a rising trendline off the $1.00 August low, now near $1.37. The two lines converge near $1.60 in the coming weeks, so a decisive move is getting closer.
The rising trendline sits right where the 200-day EMA at $1.3683 and the 50-day EMA at $1.3605 cluster, which makes $1.37 a stronger floor than any single indicator would be alone. XRP has about $0.11 of cushion above it, and it still trades above the 20-day EMA at $1.4515, with the Parabolic SAR at $1.4157 below price keeping the short-term trend bullish for now.
Related: Pi Network Price Prediction: Protocol 28 Sets October Upgrade Deadline as PI Trades Near $0.089
XRP Support and Resistance Levels
| Type | Price |
| Resistance | $1.55 |
| Resistance | $1.64 |
| Resistance | $1.70 |
| Support | $1.4515 |
| Support | $1.4157 |
| Support | $1.3683 |
XRP News: Peter Brandt Says the Charts Alone Justify Owning XRP
Veteran trader Peter Brandt said owning XRP doesn’t require being a “certified cult member,” arguing the charts are reason enough to hold a position. The $5.40 projection attached to his comments is the same long-term chart he posted last week, so it isn’t new, and he repeated that publishing a chart is not the same as holding a trade.
Two other analysts pointed to the same price area:
- Ali Martinez flagged an inverse head and shoulders pattern with a neckline near $1.55, where a confirmed breakout could push XRP toward $2, roughly 30% higher
- Dark Defender called a parabolic move inevitable soon
XRP has since slipped below that neckline area, trading near $1.48 against the roughly $1.52 cited in the report.
XRP Derivatives: Longs Take the Hit as Trading Volume Jumps
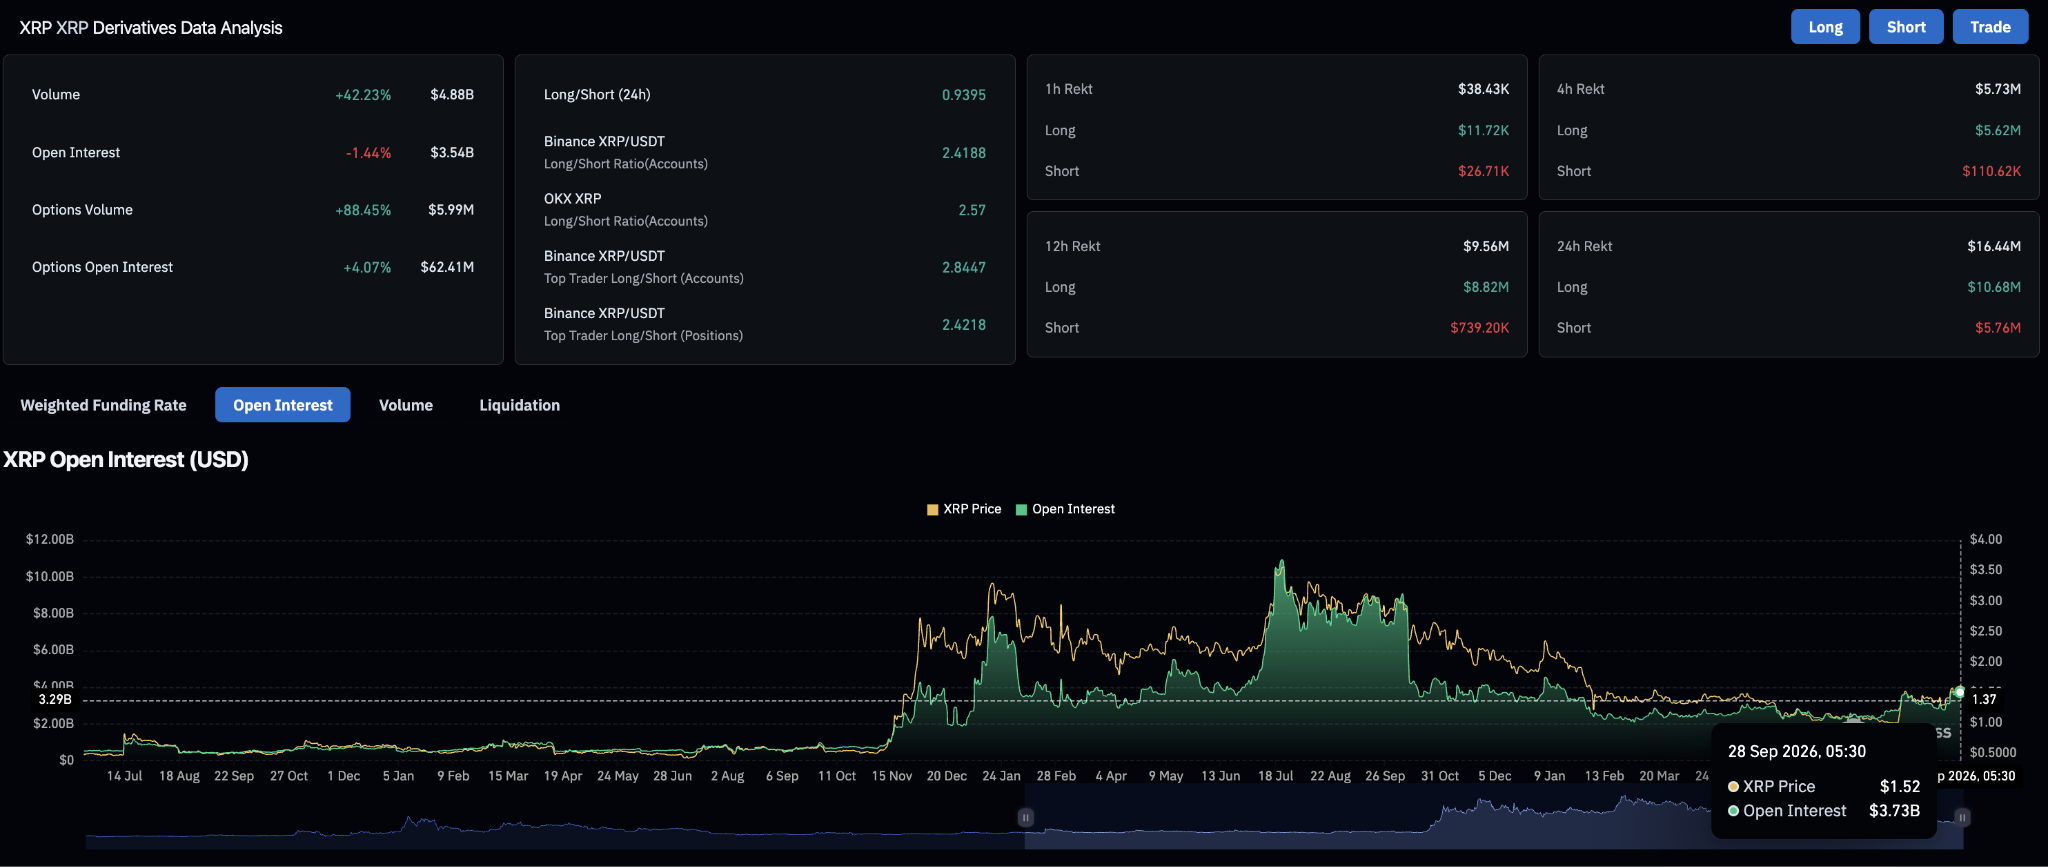
XRP derivatives volume jumped 42.23% to $4.88 billion over the past 24 hours, while open interest, the total value of open bets, slipped 1.44% to $3.54 billion. More trading alongside fewer open positions points to traders being forced out rather than adding new bets.
Related: Pump.fun Price Prediction: PUMP Gains 17% as Buying Activity Strengthens
Longs took the bigger hit, with traders betting on higher prices losing $10.68 million against $5.76 million for those betting on lower prices, and nearly all of the last four hours’ $5.73 million came from longs. The crowd still leans bullish overall, with Binance showing 2.42 long accounts for every short account.
| Metric | Value | What it shows |
| Derivatives volume (24h) | $4.88B, up 42.23% | Trading activity jumped |
| Open interest | $3.54B, down 1.44% | Traders closing or forced out |
| 24h long liquidations | $10.68M of $16.44M total | Longs took the bulk of the losses |
| Binance long/short ratio | 2.42 | Traders still leaning long |
XRP ETF Flows: An 11th Straight Week of Inflows Pushes Cumulative Total to $1.79 Billion
US spot XRP ETFs added $22.65 million on September 25, capping a $75.59 million week that marked the 11th consecutive week of inflows and the largest weekly total since $110.49 million in late August. Cumulative net inflows stand at $1.79 billion, with total net assets at $1.77 billion.
Bitwise’s XRP fund led Friday’s inflow at $18.39 million and remains the largest fund by net assets at $647.83 million, while Franklin’s XRPZ added $4.26 million and the other three funds were flat. 21Shares’ TOXR is still the only fund net negative since launch, down $21.15 million.
| ETF Metric | Value |
| Daily net inflow, Sep 25 | +$22.65M |
| Weekly net inflow, week ending Sep 25 | +$75.59M |
| Cumulative net inflow | $1.79B |
| Total net assets | $1.77B |
XRP Exchange Flows: More Coins Leave Exchanges Than Arrive
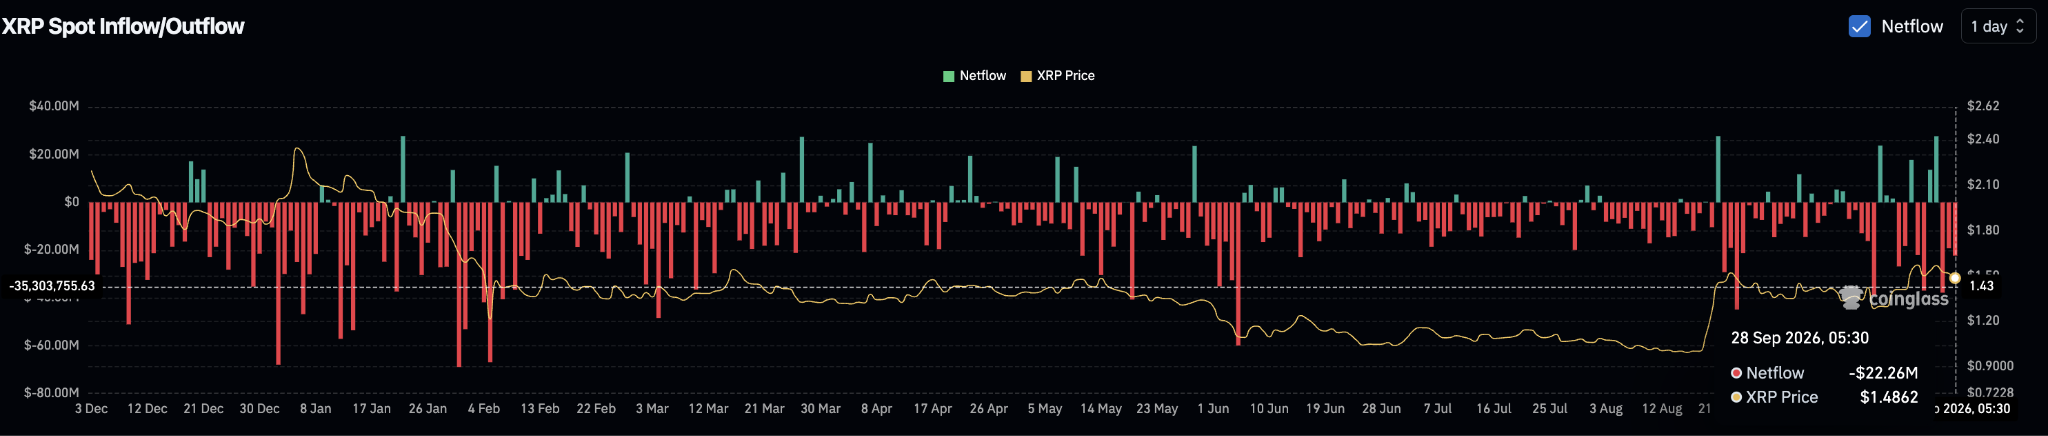
XRP’s spot netflow reads -$22.26 million so far today, meaning more coins left exchanges than arrived, which is typically read as holders moving XRP off trading venues rather than lining it up to sell.
This tracks coins moving on and off exchanges, a separate measure from the ETF flows above.
XRP Price Prediction: Bullish and Bearish Scenarios
Bullish Case, Target: $1.64 (Upper Triangle Trendline)
XRP holds the 20-day EMA at $1.4515 and reclaims the $1.55 neckline area analysts are watching. A confirmed break would put the triangle’s upper trendline near $1.64 in reach, and the $2 target cited by Ali Charts would need that trendline to clear first.
Bearish Case, Risk Level: $1.37 (200-Day EMA)
XRP loses the 20-day EMA and the Parabolic SAR at $1.4157. More long liquidations would fit that scenario, exposing $1.3683, where the rising triangle trendline, the 200-day EMA, and the 50-day EMA at $1.3605 all meet, and a close below that would break the triangle’s lower boundary.
FAQs
XRP could extend toward $1.55 and then the triangle’s upper trendline near $1.64 if it holds above the 20-day EMA at $1.4515. Losing that level risks a slide toward $1.3683, where the 200-day EMA and the triangle’s rising support meet.
It would need to clear roughly $1.55 first, the neckline of an inverse head and shoulders pattern flagged by analyst Ali Charts, who says a confirmed breakout could carry price toward $2. XRP is trading below that neckline now, so it remains a scenario rather than a forecast.
Peter Brandt’s long-term chart implies an eventual advance to $5.40, but he described it as a projection rather than an active trade, and it reflects a decade of price structure rather than a near-term target.
Yes. US spot XRP ETFs logged an 11th consecutive week of inflows, adding $75.59 million last week and bringing cumulative net inflows to $1.79 billion. Two things to check: the triangle trendline values ($1.64 upper, $1.37 lower) are read off the chart by eye, and BeInCrypto’s $1.52 is older than the chart’s $1.4793, so I used the chart price.
Disclaimer: The information presented in this article is for informational and educational purposes only. The article does not constitute financial advice or advice of any kind. Coin Edition is not responsible for any losses incurred as a result of the utilization of content, products, or services mentioned. Readers are advised to exercise caution before taking any action related to the company.