


 Price Prediction 2023-2030: Will FLM Price Reach $1 Soon?")
- Bullish FLM price prediction ranges from $0.30 to $0.45.
- FLM price might also reach $0.8 this 2023.
- FLM’s bearish market price prediction for 2023 is $0.0512.
Decentralized Finance (DeFi) platforms have become popular this year as the demand for decentralization continues to rise. Flamingo Finance’s native token, FLM has recently entered the market as one of the top trending coins. Flamingo Finance is a DeFi platform that allows users to convert assets, wrap assets, and perform various other functions.
Flamingo has many features enabling users to access a wide range of operations. One of the main focuses was decentralization, which could indicate giving power back to the people. Moreover, Flamingo hopes to accelerate Neo’s DeFi ecosystem by continuing to develop and improve the platform.
If you are interested to learn about FLM’s price analysis and forecast for the years 2023, 2024, 2025, 2026, 2027, until 2050, read this Coin Edition price prediction article.
Table of contents
- Flamingo (FLM) Market Overview
- What is Flamingo (FLM)?
- Flamingo (FLM) Current Market Status
- Flamingo (FLM) Price Analysis 2023
- Flamingo (FLM) Price Prediction 2023-2030 Overview
- Flamingo (FLM) Price Prediction 2023
- Flamingo (FLM) Price Prediction 2024
- Flamingo (FLM) Price Prediction 2025
- Flamingo (FLM) Price Prediction 2026
- Flamingo (FLM) Price Prediction 2027
- Flamingo (FLM) Price Prediction 2028
- Flamingo (FLM) Price Prediction 2029
- Flamingo (FLM) Price Prediction 2030
- Flamingo (FLM) Price Prediction 2040
- Flamingo (FLM) Price Prediction 2050
- Conclusion
- FAQs
- More Crypto Price Predictions:
Flamingo (FLM) Market Overview
HTTP Request Failed... Error: file_get_contents(https://pro-api.coinmarketcap.com/v2/cryptocurrency/quotes/latest?slug=flamingo-finance): Failed to open stream: HTTP request failed! HTTP/1.1 400 Bad Request
What is Flamingo (FLM)?
Flamingo Finance defines itself as a decentralized Finance (DeFi) platform where users can convert assets, wrap assets, provide liquidity, and earn yield through staking. Flamingo Fiannce provides a wide range of asset actions: SmartStake, Convert, Wrap & Unwrap, Add Liquidity, Remove Liquidity, Stake, and Unstake.
Flamingo’s unique SmartStake allows users to perform all the asset actions such as wrap assets, add liquidity to a trading pair liquidity pool, and stake their LP tokens “all in just one click.” Moreover, Flamingo also allows automated transactions to take place between crypto tokens on the Neo N3 blockchain through the use of smart contracts.
Flamingo’s FLM functions as a reward token by allowing users to earn by adding liquidity to liquidity pools and staking their liquidity pools tokens. Moreover, FLM tokens would also be awarded to users for holding a portion of the DEX-Traded Fund (DTF), Flamingo Flund.
The Flamingo Flund is another unique feature of Flamingo Finance, which is defined as a “DEX-Traded Fund.” As explained on the website, The Flund is non-inflationary and will not dump the token price once minting is done. Moreover, it is mentioned that the Flamingo Flund is expected frow every time a trade is made on Flamingo.
Flamingo (FLM) Current Market Status
At the time of writing, FLM is now trading at $0.09837 with a total market capitalization of $48,160,398. FLM sits in 363 place on CoinMarketCap in terms of market capitalization. Moreover, there has been a price change of 21.02% surge in the past 24 hours. FLM’s 24-hour trading volume is $ $150,654,373, with a rise of 726.28%.
FLM can be traded on major cryptocurrency exchanges such as Binance, OKX, Bitrue, Bytbit, and Bitget.
Flamingo (FLM) Price Analysis 2023
Will FLM’s most recent improvements, additions, and modifications help its price rise? Moreover, would the changes in the blockchain industry affect FLM’s sentiment over time? Read more to find out about FLM’s 2023 price analysis.
Flamingo (FLM) Price Analysis – Bollinger Bands
The Bollinger Bands is a technical analysis tool that is used to analyze price movement and volatility. Bollinger Bands (BB) utilizes the time period and the stand deviation of the price. Normally, the default value of BB’s period is set at 20. The upper band of the BB is calculated by adding 2 times the standard deviations to the Simple Moving Average (SMA), while the lower band is calculated by subtracting 2 times the standard deviation from the SMA. Based on the empirical law of standard deviation, 95% of the data sets will fall within the two standard deviations of the mean.
Observing the chart, the candlesticks have been experiencing major spikes in their High price, however, the price would be corrected before it is closed. Currently, FLM is experiencing positive momentum in the top-half region of Bollinger Band. Moreover, the candlesticks have broken beyond the upper band, which is an indication that FLM entered the overbought region. Normally, when the candlesticks cross beyond the upper band, a price correction could be expected.
Flamingo (FLM) Price Analysis – Relative Strength Index (RSI)
The Relative Strength Index (RSI) is a momentum indicator utilized to find out the current trend of the price movement and determine if it is in the oversold or overbought region. Traders often use this tool to make decisions about when to buy or sell the tokens. When the RSI is often valued below or at 30, it is considered an oversold region, and a price correction could happen soon. Moreover, when the RSI is valued above or at 70, it is regarded as the overbought region, and traders expect the price could fall soon.
The RSI is valued at 69.41, after facing a price correction from the overbought region. The RSI also shows that FLM shot upwards on the same after experiencing major buying pressure, thus, landing itself in the overbought region. Although it is expected that the candlesticks could fall below into the downtrend, FLM has a gigantic gap left to cover up before it faces the bears. Ultimately, FLM could remain within the 50 and 70 regions of RSI for some time.
Flamingo (FLM) Price Analysis – Moving Average (MA)
FLM/ USDT 1-day chart highlights that a death cross has been formed after the 50MA crossed below the 200MA, indicating that candlesticks could face a bearish trend. However, against the predictions of the MA indicators, FLM experienced a major spike which led it to cross beyond the 200MA and the 50Ma indicators. However, traders need to wait for confirmation on whether the candlesticks would continue to remain above the MA indicators.
Flamingo (FLM) Price Analysis – Moving Average Convergence Divergence (MACD)
The Moving Average Convergence Divergence (MACD) indicator can be used to identify potential price trends, momentums, and reversals in markets. MACD will simplify the reading of a moving average cross easier. The MACD indicator is calculated by subtracting the long-term EMA (Exponential Moving Average) indicator from the short-term EMA. Normally, the default values for the MACD are set at 12-day EMA, 26-day EMA, and 9-day EMA. Moreover, MACD is considered a lagging indicator as it cannot provide trade signals without any past price data. MACD plays an important role as it can confirm the trends and identify potential reversals.
Looking at the chart, the MACD formed a bullish crossover after the MACD line crossed above the signal line. Moreover, the histogram shows that the green bars continue to rise, however, since the candlesticks hit the overbought region, there is a chance that red bars would soon be formed. Ultimately, FLM is expected to face a price correction after experiencing a major spike which led it into the overbought region.
Flamingo (FLM) Price Prediction 2023-2030 Overview
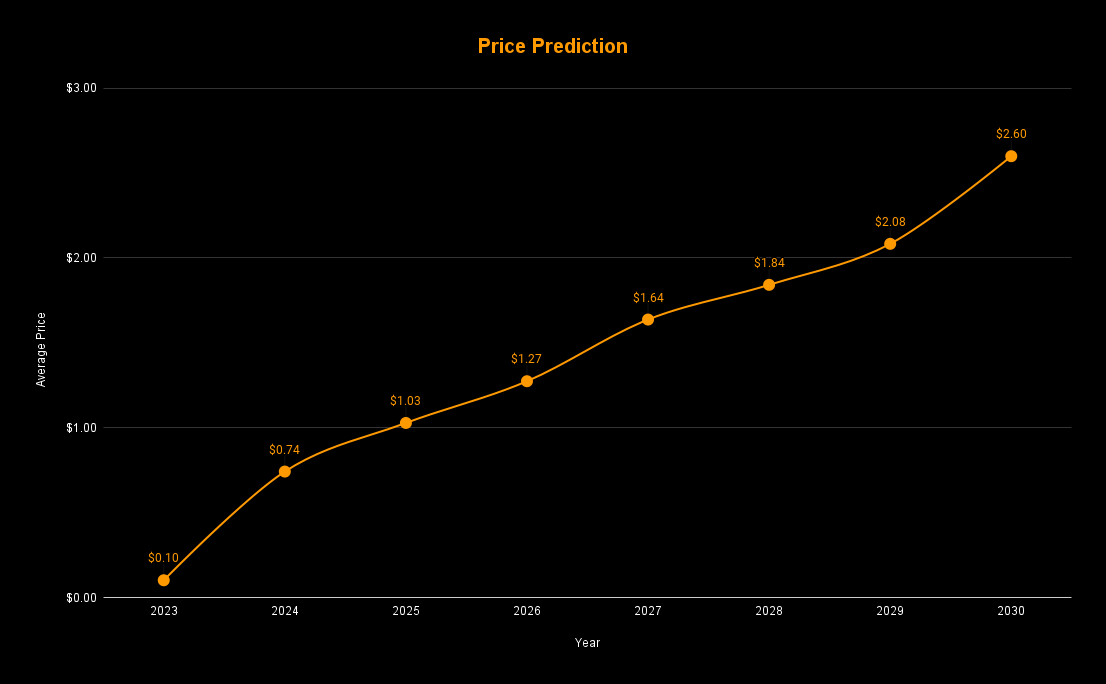
| Year | Minimum Price | Average Price | Maximum Price |
| 2023 | $0.0512 | $0.1032 | $0.4578 |
| 2024 | $0.3351 | $0.7428 | $1.0939 |
| 2025 | $0.6321 | $1.0288 | $1.3417 |
| 2026 | $1.0261 | $1.2745 | $1.4723 |
| 2027 | $1.3822 | $1.6374 | $1.7871 |
| 2028 | $1.6902 | $1.8417 | $2.0591 |
| 2029 | $1.8644 | $2.0829 | $2.3145 |
| 2030 | $2.4008 | $2.5987 | $2.6961 |
| 2040 | $4.33 | $5.28 | $5.97 |
| 2050 | $9.85 | $10.03 | $10.90 |
Flamingo (FLM) Price Prediction 2023
The FLM/USDT 1-Day chart shows that the candlestick has recently experienced a major spike over the day. However, there is a chance that it may experience a price correction after it entered the overbought region. Moreover, the MACD also confirms the sudden spike after a bullish crossover was observed, where the MACD line crossed above the signal line. The ADX also confirms that the current trend is really strong as it is valued at 42.43.
Meanwhile, the price prediction of FLM for 2023 remains to be bullish and is expected to reach beyond the level of $0.45. The bearish price prediction range for FLM is between $0.0468 to $0.0512. However, if FLM continues to experience extremely bullish sentiment, then it would reach the $0.8 level.
| Bullish Price Prediction | Bearish Price Prediction |
| $0.30 – $0.45 | $0.0468 – $0.0512 |
Flamingo (FLM) Price Prediction 2023 – Resistance and Support
FLM recently experienced a major spike as its high price almost touched the Resistance 1 level. If FLM experiences a bullish period, it has the potential to reach its extreme bullish area at the $0.6 level. FLM has the potential to reach resistance level 6 at $0.8 level if it continues to experience a bullish period. When FLM passes through each Resistance, each level could become a new Support level.
Flamingo (FLM) Price Prediction 2024
Traders are looking forward to this year as it could be a historic moment for cryptocurrencies, as the Bitcoin halving is expected to happen in 2024. Most of the time, whenever BTC rises, traders have observed a similar surge in the altcoins. FLM could also be affected by Bitcoin halving and could trade beyond the price of $1 by the end of 2024.
Flamingo (FLM) Price Prediction 2025
FLM could still experience the after-effects of the Bitcoin halving and is expected to trade above its 2024 price. Many trade analysts speculate that BTC halving could create a huge impact on the crypto market. Moreover, similar to many altcoins, FLM will continue to rise in 2025 forming new resistance levels. It is expected that FLM would trade beyond the $1.3 level.
Flamingo (FLM) Price Prediction 2026
It is expected that after a long period of bull run, the bears would come into power and start negatively impacting the cryptocurrencies. During this bearish sentiment, FLM could tumble into its support region of $1.1. Moreover, when FLM remains in the oversold region, there could be a price correction soon. FLM, by the end of 2026, could be trading beyond the $1.4 resistance level after experiencing the price correction.
Flamingo (FLM) Price Prediction 2027
Naturally, traders expect a bullish market sentiment after the crypto industry was affected negatively by the bears’ claw. FLM is expected to rise after its slumber in the bear season. Moreover, FLM could even break more resistance levels as it continues to recover from the bearish run. Therefore, FLM is expected to trade at $1.7 by the end of 2027.
Flamingo (FLM) Price Prediction 2028
Once again, the crypto community is looking forward to this year as there will be a Bitcoin halving. Alike many altcoins, FLM will continue to form new higher highs and is expected to move in an upward trajectory. Hence, FLM would be trading at $2 after experiencing a massive surge by the end of 2028.
Flamingo (FLM) Price Prediction 2029
2029 is expected to be another bull run due to the aftermath of the BTC halving. However, traders speculate that the crypto market would gradually become stable by this year. In tandem with the stable market sentiment and the slight price surge expected after the aftermath, FLM could be trading at $2.3 by the end of 2029.
Flamingo (FLM) Price Prediction 2030
After witnessing a bullish run in the market, FLM and many altcoins would show signs of consolidation and might trade sideways for some time while experiencing minor spikes. Therefore, by the end of 2030, FLM could be trading at $2.6.
Flamingo (FLM) Price Prediction 2040
The long-term forecast for FLM indicates that this altcoin could reach a new all-time high(ATH). This would be one of the key moments as HODLERS may expect to sell some of their tokens at the ATH point. However, FLM may face a slight fall before starting its upward journey once again. It is expected that the price of FLM could reach $5 by 2040.
| Minimum Price | Average Price | Maximum Price |
| $4.33 | $5.28 | $5.97 |
Flamingo (FLM) Price Prediction 2050
The community believes that there will be widespread adoption of cryptocurrencies, which could maintain gradual bullish gains. By the end of 2050, if the bullish momentum is maintained, FLM could surpass the resistance level of $10.
| Minimum Price | Average Price | Maximum Price |
| $9.85 | $10.03 | $10.90 |
Conclusion
To summarize, if investors continue to show interest in FLM and add these tokens to their portfolio, then, it could continue to rise up. FLM’s bullish price prediction shows that it could pass beyond the $0.6 level in 2023. Moreover, FLM could surpass the $10 level by the end of 2050.
FAQs
Flamingo’s FLM functions as a reward token by allowing users to earn by adding liquidity to liquidity pools and staking their liquidity pools tokens. Moreover, FLM tokens would also be awarded to users for holding a portion of the DEX-Traded Fund (DTF), Flamingo Flund.
Flamingo’s feature could increase the demand for FLM, the native token of the network. Moreover, users and developers are always on the lookout for new innovative DeFi projects which could drive FLM’s price upwards.
FLM can be traded on many exchanges like other digital assets in the crypto world. Binance, OKX, Bitrue, Bytbit, and Bitget are currently popular exchanges for trading FLM.
The maximum supply of FLM is 1,000,000,000 FLM.
Reportedly, Da Hongfei is the founder of Flamingo.
FLM can be stored in a cold wallet, hot wallet, or exchange wallet.
FLM is expected to reach $0.6 in 2023.
FLM is expected to reach $1 in 2024.
FLM is expected to reach $1.3 in 2025.
FLM is expected to reach $1.4 in 2026.
FLM is expected to reach $1.7 in 2027.
FLM is expected to reach $2 in 2028.
FLM is expected to reach $2.3 in 2029.
FLM is expected to reach $2.6 in 2030.
FLM is expected to reach $5 in 2040.
FLM is expected to reach $10 in 2050.
Disclaimer: The views and opinions, as well as all the information shared in this price prediction, are published in good faith. Readers must do their research and due diligence. Any action taken by the reader is strictly at their own risk. Coin Edition and its affiliates will not be held liable for any direct or indirect damage or loss.
More Crypto Price Predictions:
- GMX Price Prediction 2023-2030
- DYDX Price Prediction 2023-2030
- SafePal Price Prediction 2023-2030
- Fantom (FTM) Price Prediction 2023-2030
- Linear Finance (LINA) Price Prediction 2023-2030
Disclaimer: The information presented in this article is for informational and educational purposes only. The article does not constitute financial advice or advice of any kind. Coin Edition is not responsible for any losses incurred as a result of the utilization of content, products, or services mentioned. Readers are advised to exercise caution before taking any action related to the company.
 Price Prediction 2026-2030: Will TRX Hit $0.50 Soon?")
 Price Prediction 2026-2050: Will HYPE Hit $100 Soon?")


: What Happens If You Use an Unlicensed Platform?")