


- Bullish GMX (GMX) price prediction ranges from $67.7823 to 72.758.
- GMX price might also reach $100 soon.
- GMX’s bearish market price prediction for 2023 is $39.760.
The concept of decentralization has grown as users realize its importance as time passes. GMX allows users access to decentralization features through its spot and perpetual exchange. Moreover, GMX enables trading with BTC, ETH, and various other top cryptocurrencies directly from the user’s wallet.
GMX consists of two tokens that help in empowering their ecosystem. GMX is the utility and governance token of the platform. Meanwhile, GLP is a liquidity provider token. GMX also holds various other benefits for the holders.
If you want to learn about GMX’s price analysis and forecast for 2023, 2024, 2025, 2026, 2027, 2028 until 205, read this Coin Edition price prediction article.
Table of contents
- GMX (GMX) Market Overview
- What is GMX (GMX)?
- Analyst’s View on GMX
- GMX Current Market Status
- GMX Price Analysis 2023
- GMX Price Prediction 2023-2030 Overview
- GMX Price Prediction 2023
- GMX Price Prediction 2024
- GMX Price Prediction 2025
- GMX Price Prediction 2026
- GMX Price Prediction 2027
- GMX Price Prediction 2028
- GMX Price Prediction 2029
- GMX Price Prediction 2030
- GMX Price Prediction 2040
- GMX Price Prediction 2050
- Conclusion
- FAQ
- More Crypto Price Predictions:
GMX (GMX) Market Overview
| 🪙 Name | GMX |
| 💱 Symbol | GMX |
| 🏅 Rank | #308 |
| 💲 Price | $6.3649241543208 |
| 📊 Price Change (1h) | -0.24 % |
| 📊 Price Change (24h) | 3.71 % |
| 📊 Price Change (7d) | 5.11 % |
| 💵 Market Cap | $66429886.654109 |
| 💸 Circulating Supply | 10436870.109287 GMX |
| 💰 Total Supply | 10436870.109287 GMX |
GMX (GMX) is currently trading at $6.3649241543208 and sits at number #308 on CoinMarketCap in terms of market capitalization. There are 10436870.109287 GMX coins currently in circulation, bringing the total market cap to $66429886.654109.
Over the past 24 hours, GMX has increased by 3.71%. Looking at the last week, the coin is up by 5.11%.
What is GMX (GMX)?
GMX is a decentralized spot and perpetual exchange that allows users to trade Bitcoin (BTC), Ethereum (ETH), and other major cryptocurrencies straight from their cryptocurrency wallets. The GMX user may execute spot swaps and trade perpetual futures with up to 50x leverage, just as on a centralized exchange. Unlike a centralized exchange, they preserve custody of their assets by using a cryptocurrency wallet.
The GMX token serves as both a utility and a governance token, and token holders may utilize it to vote on ideas that will help shape the exchange’s future.
Token holders who stake their GMX receive three additional prizes that the system employs to reward users. To begin, GMX stakeholders receive 30% of all acquired protocol fees. These costs are paid in ETH or AVAX and are collected via market making, swap fees, and leverage trading.
The stakers also receive escrowed GMX (esGMX) tokens. These esGMX tokens can be staked or invested in exchange for rewards, and the tokens are converted back into GMX over 12 months when a user stakes GMX. esGMX emissions are a type of locked staking that stops users from selling their GMX right away.
Last but not least, stakers accumulate Multiplier Points that increase their yield and reward long-term investors without causing token inflation. These two incentives encourage loyalty to GMX and advance decentralized platform ownership.
Through a straightforward swap interface that resembles conventional trading platforms, GMX enables traders to open leveraged positions. Additionally, because GMX is self-custodial and trustless, anybody may trade cryptocurrencies directly from their private wallet.
Its dual exchange model supports both spot swaps and leveraged trading of perpetual swaps. Due to the high asset utilization of the GLP pool, which enables user deposits to create additional yield instead of sitting dormant, this should increase capital efficiency.
On GMX, trading positions may be entered and exited without affecting prices. With this approach, traders can obtain better entry prices than on some order book-based exchanges with slippage. In addition, GMX smooths out price variations using a combination of Chainlink Oracles and other price feeds, which helps protect holdings against wicks that cause brief liquidation of positions.
Analyst’s View on GMX
A crypto analyst on Twitter tweeted that GMX is one of the mid-cap coins investors might want to invest in. He even mentioned that 30% of the investment portfolio could be invested in GMX.
Moreover, a crypto investor with over 350K followers on Twitter, Lady of Crypto, tweeted that she is now making a lot of money by investing in GMX although every mainstream coin is crashing at the moment. We can observe that she is a strong believer in GMX.
Another tweet from the founder of Altcryptotalk trading community states that if investors are holding GMX right now and after holding GMX for two years, there may be a possibility that they might become a billionaire.
GMX Current Market Status
With 8,790,974.38 GMX in circulation, GMX is trading at $47.59 at the time of writing, based on CoinMarketCap. GMX has a 24-hour trading volume of $23,700,617. Moreover, the price of GMX increased by 8.36% during the previous 24 hours.
Binance, Kucoin, Krakenl, OKX, Gate.io, and Bybit are currently the most popular cryptocurrency exchanges for GMX trading.
GMX Price Analysis 2023
Currently, GMX ranks 81 on CoinMarketCap. Will GMX’s most recent improvements, additions, and modifications help the price of cryptocurrencies rise? First, let’s focus on the charts in this article’s GMX price forecast.
GMX Price Analysis – Bollinger Bands
The Bollinger Bands is a technical analysis tool that is used to analyze price movement and volatility. Bollinger Bands (BB) utilizes the time period and the stand deviation of the price. Normally, the default value of BB’s period is set at 20. The upper band of the BB is calculated by adding 2 times the standard deviations to the Simple Moving Average (SMA), while the lower band is calculated by subtracting 2 times the standard deviation from the SMA. Based on the empirical law of standard deviation, 95% of the data sets will fall within the two standard deviations of the mean.
GMX’s candlesticks have touched the lower band, indicating that the altcoin entered the oversold territory. However, after touching the band, green candlesticks have recently formed indicating that it may soon climb upwards. Moreover, the upward movement can be confirmed as there is a signal that a trend reversal could happen as the bands continue to expand. The Bollinger Band Width also confirms this hypothesis that the GMX’s market may experience high volatility as it continues to move upwards.
GMX Price Analysis – Relative Strength Index (RSI)
The Relative Strength Index (RSI) is a momentum indicator utilized to find out the current trend of the price movement and determine if it is in the oversold or overbought region. Traders often use this tool to make decisions about when to buy or sell the tokens. When the RSI is often valued below or at 30, it is considered an oversold region, and a price correction could happen soon. Moreover, when the RSI is valued above or at 70, it is regarded as the overbought region, and traders expect the price could fall soon.
The RSI is currently valued at 39.67 and is still considered a weak trend by most traders as it is valued between 50 and 30. However, the RSI indicator also confirms that GMX may show a positive sentiment as the RSI crossed above the SMA, which could be considered a bullish trend. Moreover, the RSI continues to be pointed upwards and there is a high possibility that it may reach a strong trend valued between 50 and 70 during GMX’s bullish trend.
GMX Price Analysis – Moving Average (MA)
The candlesticks are below the 200MA and the 50MA, indicating that GMX is witnessing a downtrend. The 4-Hour GMX/USD also shows that the newly-formed candles moved upwards and entered the consolidation area indicating that there may be an uptrend in the future. However, traders need to be careful in the consolidation area as previous price actions suggest that GMX fell after a slight uptrend into the consolidation area.
GMX Price Analysis – Moving Average Convergence Divergence (MA)
The Moving Average Convergence Divergence (MACD) indicator can be used to identify potential price trends, momentums, and reversals in markets. MACD will simplify the reading of a moving average cross easier. The MACD indicator is calculated by subtracting the long-term EMA (Exponential Moving Average) indicator from the short-term EMA. Normally, the default values for the MACD are set at 12-day EMA, 26-day EMA, and 9-day EMA. Moreover, MACD is considered a lagging indicator as it cannot provide trade signals without any past price data. MACD plays an important role as it can confirm the trends and identify potential reversals.
Although the candlestick was facing a gradual decline over the past few days, the MACD indicator shows that there a positive momentum may happen soon for GMX. The MACD line met the signal line at the crossroad indicating that a bullish crossover may take place soon. The bullish crossover would act as a signal that GMX may experience an uptrend in the short term period. If the bullish crossover takes place and the GMX uptrend starts, then, the candlesticks could escape from the Support region.
GMX Price Prediction 2023-2030 Overview
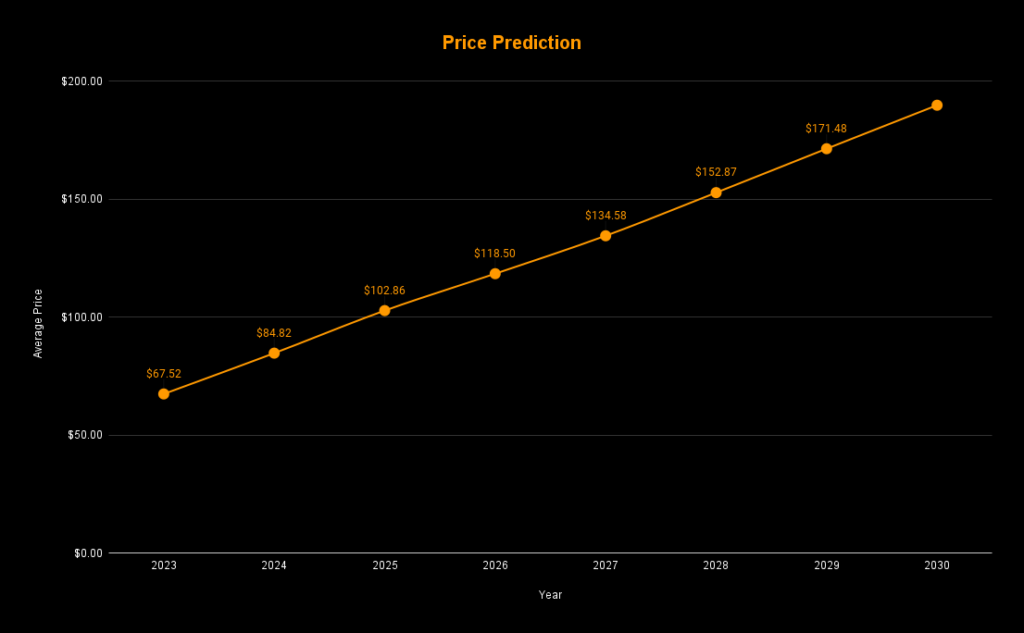
| Year | Minimum Price | Average Price | Maximum Price |
| 2023 | $43.695 | $67.520 | $80.750 |
| 2024 | $78.089 | $84.820 | $92.720 |
| 2025 | $93.259 | $102.860 | $107.890 |
| 2026 | $108.892 | $118.499 | $123.535 |
| 2027 | $124.968 | $134.575 | $139.611 |
| 2028 | $143.259 | $152.866 | $157.902 |
| 2029 | $161.869 | $171.476 | $176.512 |
| 2030 | $180.309 | $189.916 | $194.952 |
| 2040 | $195 | $250 | $310 |
| 2050 | $476 | $530 | $580 |
GMX Price Prediction 2023
GMX is currently trading between the Weak Resistance and the Support region. The candlesticks deflected from the Support region after facing a gradual fall over time. Moreover, the MACD line may form a bullish crossover if it crosses above the signal line. After forming new green candlesticks, GMX is experiencing a very strong strength in its trend as the ADX is valued at 39.24. Traders should wait for the confirmation before entering the trade such as the bullish crossover and the ADX’s continuous confirmation of trend strength.
Meanwhile, the price prediction of GMX for 2023 remains to be bullish and is expected to reach beyond the level of $67.7823 The bearish price prediction range for GMX is between $37.812 to $39.760. However, if GMX experiences extreme bullish sentiment, then it would reach the $90 level.
| Bullish Price Prediction | Bearish Price Prediction |
| $67.7823 – 72.758 | $37.812 – $39.760 |
GMX Price Prediction 2023 – Resistance and Support Levels
The candlesticks recently bounced away from the Support level after facing a downfall. If GMX experiences a bullish period, it has the potential to reach its extreme bullish area at the $67 level. GMX has the potential to reach resistance level 2 at the $90 level if it continues to experience an extremely bullish period. Moreover, when GMX passes through each Resistance, each level could become a new Support level.
| Month | Minimum Price | Average Price | Maximum Price |
| July 2023 | 43.695 | 55.720 | 63.743 |
| August 2023 | 54.469 | 67.520 | 72.541 |
| September 2023 | 69.099 | 70.120 | 76.180 |
| October 2023 | 72.897 | 74.920 | 77.943 |
| November 2023 | 74.875 | 75.900 | 79.921 |
| December 2023 | 75.570 | 76.690 | 80.750 |
GMX Price Prediction 2024
GMX (GMX) price can rise to incredible heights, peaking at $92.66. It is feasible only if the market continues its upward path and GMX breaks through the past psychological resistance levels.
| Month | Minimum Price | Average Price | Maximum Price |
| January 2024 | 78.089 | 78.110 | 78.133 |
| February 2024 | 79.927 | 79.940 | 79.969 |
| March 2024 | 81.765 | 81.790 | 81.850 |
| April 2024 | 83.498 | 83.510 | 83.533 |
| May 2024 | 84.799 | 84.820 | 84.841 |
| June 2024 | 85.697 | 85.720 | 85.780 |
| July 2024 | 87.665 | 87.690 | 87.713 |
| August 2024 | 88.439 | 88.490 | 88.511 |
| September 2024 | 90.069 | 90.090 | 90.150 |
| October 2024 | 90.867 | 90.890 | 90.913 |
| November 2024 | 91.845 | 91.870 | 91.891 |
| December 2024 | 92.540 | 92.660 | 92.720 |
GMX Price Prediction 2025
GMX prices might grow to $107.830 during the next three years. This is only feasible if the market continues its upward path and if GMX breaks through the past psychological resistance levels.
| Month | Minimum Price | Average Price | Maximum Price |
| January 2025 | 93.259 | 93.280 | 93.303 |
| February 2025 | 95.097 | 95.110 | 95.139 |
| March 2025 | 96.935 | 96.960 | 97.020 |
| April 2025 | 98.668 | 98.680 | 98.703 |
| May 2025 | 99.969 | 99.990 | 100.011 |
| June 2025 | 100.867 | 100.890 | 100.950 |
| July 2025 | 102.835 | 102.860 | 102.883 |
| August 2025 | 103.609 | 103.660 | 103.681 |
| September 2025 | 105.239 | 105.260 | 105.320 |
| October 2025 | 106.037 | 106.060 | 106.083 |
| November 2025 | 107.015 | 107.040 | 107.061 |
| December 2025 | 107.710 | 107.830 | 107.890 |
GMX Price Prediction 2026
GMX prices might grow to $123.475 during the next four years. The growth will continue after that moderate, but no significant drops are forecast.
| Month | Minimum Price | Average Price | Maximum Price |
| January 2026 | 108.892 | 108.913 | 108.936 |
| February 2026 | 110.736 | 110.749 | 110.778 |
| March 2026 | 112.574 | 112.599 | 112.659 |
| April 2026 | 114.307 | 114.319 | 114.342 |
| May 2026 | 115.608 | 115.629 | 115.650 |
| June 2026 | 116.506 | 116.529 | 116.589 |
| July 2026 | 118.474 | 118.499 | 118.522 |
| August 2026 | 119.248 | 119.299 | 119.320 |
| September 2026 | 120.878 | 120.899 | 120.959 |
| October 2026 | 121.676 | 121.699 | 121.722 |
| November 2026 | 122.658 | 122.683 | 122.704 |
| December 2026 | 123.355 | 123.475 | 123.535 |
GMX Price Prediction 2027
Investors expect a bullish run in 2027 due to the halving of Bitcoin. GMX prices might soar to $139.551 in the next five years. Furthermore, hitting this level may be easy for GMX as other mediums, such as short-term and long-term price objectives for purchase or sell orders, may be discovered.
| Month | Minimum Price | Average Price | Maximum Price |
| January 2027 | 124.968 | 124.989 | 125.012 |
| February 2027 | 126.812 | 126.825 | 126.854 |
| March 2027 | 128.650 | 128.675 | 128.735 |
| April 2027 | 130.383 | 130.395 | 130.418 |
| May 2027 | 131.684 | 131.705 | 131.726 |
| June 2027 | 132.582 | 132.605 | 132.665 |
| July 2027 | 134.550 | 134.575 | 134.598 |
| August 2027 | 135.324 | 135.375 | 135.396 |
| September 2027 | 136.954 | 136.975 | 137.035 |
| October 2027 | 137.752 | 137.775 | 137.798 |
| November 2027 | 138.734 | 138.759 | 138.780 |
| December 2027 | 139.431 | 139.551 | 139.611 |
GMX Price Prediction 2028
In 2028, Bitcoin halving will occur. Hence, the consolidating market in 2027 could be followed by a bullish run. Notably, the market could attain higher values. In the next five years, GMX prices could rise to $158. According to the forecast, GMX has a strong chance of reaching the previous ATH.
| Month | Minimum Price | Average Price | Maximum Price |
| January 2028 | 143.259 | 143.280 | 143.303 |
| February 2028 | 145.103 | 145.116 | 145.145 |
| March 2028 | 146.941 | 146.966 | 147.026 |
| April 2028 | 148.674 | 148.686 | 148.709 |
| May 2028 | 149.975 | 149.996 | 150.017 |
| June 2028 | 150.873 | 150.896 | 150.956 |
| July 2028 | 152.841 | 152.866 | 152.889 |
| August 2028 | 153.615 | 153.666 | 153.687 |
| September 2028 | 155.245 | 155.266 | 155.326 |
| October 2028 | 156.043 | 156.066 | 156.089 |
| November 2028 | 157.025 | 157.050 | 157.071 |
| December 2028 | 157.722 | 157.842 | 157.902 |
GMX Price Prediction 2029
By 2029, there could be much stability in the price of most cryptocurrencies that had stayed for over a decade. This is due to implementing lessons learned to ensure their investors retain the project’s confidence. In the next six years, GMX prices could rise to $176.45. According to the forecast, GMX has a strong chance of reaching the previous ATH.
| Month | Minimum Price | Average Price | Maximum Price |
| January 2029 | 161.869 | 161.890 | 161.913 |
| February 2029 | 163.713 | 163.726 | 163.755 |
| March 2029 | 165.551 | 165.576 | 165.636 |
| April 2029 | 167.284 | 167.296 | 167.319 |
| May 2029 | 168.585 | 168.606 | 168.627 |
| June 2029 | 169.483 | 169.506 | 169.566 |
| July 2029 | 171.451 | 171.476 | 171.499 |
| August 2029 | 172.225 | 172.276 | 172.297 |
| September 2029 | 173.855 | 173.876 | 173.936 |
| October 2029 | 174.653 | 174.676 | 174.699 |
| November 2029 | 175.635 | 175.660 | 175.681 |
| December 2029 | 176.332 | 176.452 | 176.512 |
GMX Price Prediction 2030
The cryptocurrency market experienced high stability due to the holding activities of early investors so as not to lose future gains in the price of their assets. In 2030, GMX prices could rise to $195.
| Month | Minimum Price | Average Price | Maximum Price |
| January 2030 | 180.309 | 180.330 | 180.353 |
| February 2030 | 182.153 | 182.166 | 182.195 |
| March 2030 | 183.991 | 184.016 | 184.076 |
| April 2030 | 185.724 | 185.736 | 185.759 |
| May 2030 | 187.025 | 187.046 | 187.067 |
| June 2030 | 187.923 | 187.946 | 188.006 |
| July 2030 | 189.891 | 189.916 | 189.939 |
| August 2030 | 190.665 | 190.716 | 190.737 |
| September 2030 | 192.295 | 192.316 | 192.376 |
| October 2030 | 193.093 | 193.116 | 193.139 |
| November 2030 | 194.075 | 194.100 | 194.121 |
| December 2030 | 194.772 | 194.892 | 194.952 |
GMX Price Prediction 2040
According to our long-term GMX price estimate, GMX prices could reach a new all-time high this year. If the current growth rate continues, we could anticipate an average price of $250 by 2040. If the market turns bullish, the price of GMX could go up beyond what we predicted for 2040.
| Minimum Price | Average Price | Maximum Price |
| $195 | $250 | $310 |
GMX Price Prediction 2050
According to our GMX forecast, the average price of GMX in 2050 might be above $530. If more investors are drawn to GMX between these years, the price of GMX in 2050 could be far higher than our projection.
| Minimum Price | Average Price | Maximum Price |
| $476 | $530 | $580 |
Conclusion
To summarize, if investors continue to show interest in GMX and add these tokens to their portfolio, then, it could continue to rise up. GMX’s bullish price prediction shows that it could pass beyond the $67.7823 level in 2023. Moreover, GMX could surpass the $580 level by the end of 2050.
FAQ
The GMX token serves as both a utility and a governance token, and token holders may utilise it to vote on ideas that will help shape the exchange’s future.
Token holders who stake their GMX receive three additional prizes that the system employs to reward users. To begin, GMX stakeholders receive 30% of all acquired protocol fees. These costs are paid in ETH or AVAX and are collected via market making, swap fees, and leverage trading.
Like other digital assets in the crypto world, GMX can be traded on many exchanges. Binance, Kucoin, Huobi Global, Gate.io, and Bybit are currently the most popular cryptocurrency exchanges for trading GMX.
Since GMX provides investors with several opportunities to profit from their crypto holdings, GMX is a good investment in 2023. However, GMX has a possibility of surpassing its current ATH in 2023.
GMX is one of the few active crypto assets that continue to rise in value. As long as this bullish trend continues, GMX might break through $75 and reach as high as $100. If the current market favoring crypto continues, this will likely happen.
GMX is an excellent cryptocurrency to invest in this year, given the recent partnerships that have enhanced its acceptance.
There is no data.
GMX was launched in September 2021.
Chris Larsen and Jed McCaleb founded GMX.
There is no data.
GMX can be stored in a cold wallet, hot wallet, or exchange wallet.
GMX price is expected to reach $76 by 2023.
GMX price is expected to reach $92 by 2024.
GMX price is expected to reach $107 by 2025.
GMX price is expected to reach $123 by 2026.
GMX price is expected to reach $140 by 2027.
GMX price is expected to reach $157 by 2028.
GMX price is expected to reach $176 by 2029.
GMX price is expected to reach $194 by 2030.
GMX price is expected to reach $250 by 2040.
GMX price is expected to reach $530 by 2050.
Disclaimer: The views and opinions, as well as all the information shared in this price prediction, are published in good faith. Readers must do their own research and due diligence. Any action taken by the reader is strictly at their own risk. Coin Edition and its affiliates will not be held liable for any direct or indirect damage or loss.
More Crypto Price Predictions:
- DYDX Price Prediction 2023-2030
- SafePal Price Prediction 2023-2030
- Fantom (FTM) Price Prediction 2023-2030
- Flamingo (FLM) Price Prediction 2023-2030
- Linear Finance (LINA) Price Prediction 2023-2030
Disclaimer: The information presented in this article is for informational and educational purposes only. The article does not constitute financial advice or advice of any kind. Coin Edition is not responsible for any losses incurred as a result of the utilization of content, products, or services mentioned. Readers are advised to exercise caution before taking any action related to the company.
 Price Prediction 2026-2030: Will TRX Hit $0.50 Soon?")
 Price Prediction 2026-2050: Will HYPE Hit $100 Soon?")


: What Happens If You Use an Unlicensed Platform?")