


- BONK’s momentum indicators show that daily demand has declined.
- On-chain indicators show that PEPE transactions remain profitable.
- SHIB gears for a decline as the bears re-emerge.
Meme coins registered tremendous price rallies in the last month of the 2023 trading year. One such crypto asset was Solana-based dog-themed Bonk [BONK], whose value climbed by over 250% during the 31-day period, according to data from Coingecko.
Other coins, such as Pepe [PEPE] and Shiba Inu [SHIB], saw their prices increase by 25% and 28%, respectively, within the same window period.
Profit-taking Caused BONK to Plummet
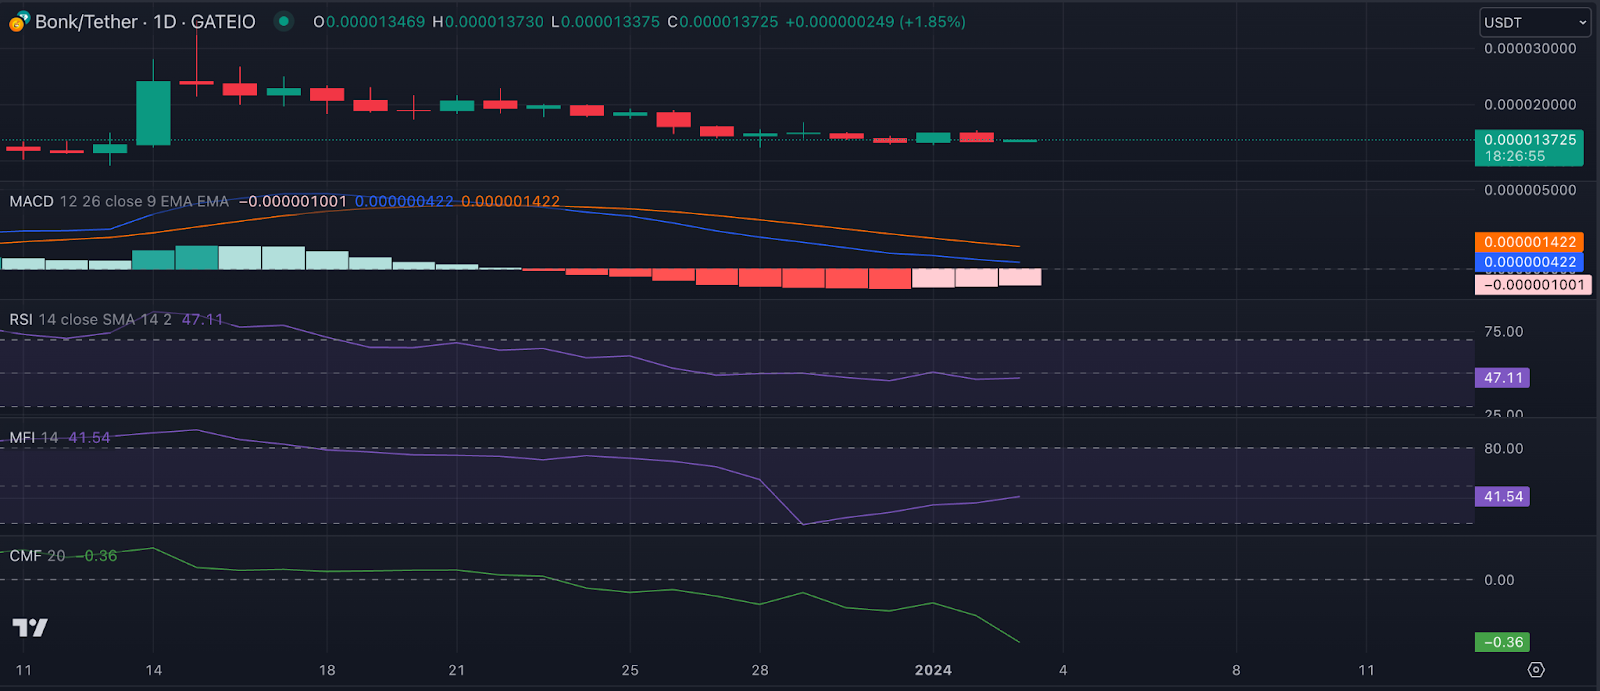
After peaking at $0.000032 on December 15, BONK initiated a decline. At that price level, the market had become severely overheated, and buyers’ exhaustion had set in. That price point also marked an all-time high causing many token holders to distribute their tokens.
Trading at $0.0000136 at press time, the altcoin’s price has since fallen by almost 54%. As its price trends downward, daily demand has also begun to fall. Key momentum indicators assessed on a daily chart showed the token’s Relative Strength Index (RSI) and Money Flow Index (MFI) below their respective center lines.
As of this writing, BONK’s RSI was 47.11, while its MFI was 41.54. At these values, these indicators showed that buying momentum has weakened as there is not a lot of liquidity flowing into the asset.
This was confirmed by its Chaikin Money Flow (CMF) which was pegged below its zero line and in the negative zone at press time. At a CMF value of -0.36 and declining, BONK has witnessed significant capital withdrawals in the past few weeks, putting further pressure on its price.
PEPE Remains in Profit Despite Consolidation
While PEPE has shed some of its gains from the peak of the market rally in October and November, it has traded at a 25% growth rate in the last 30 days, according to data from CoinMarketCap.
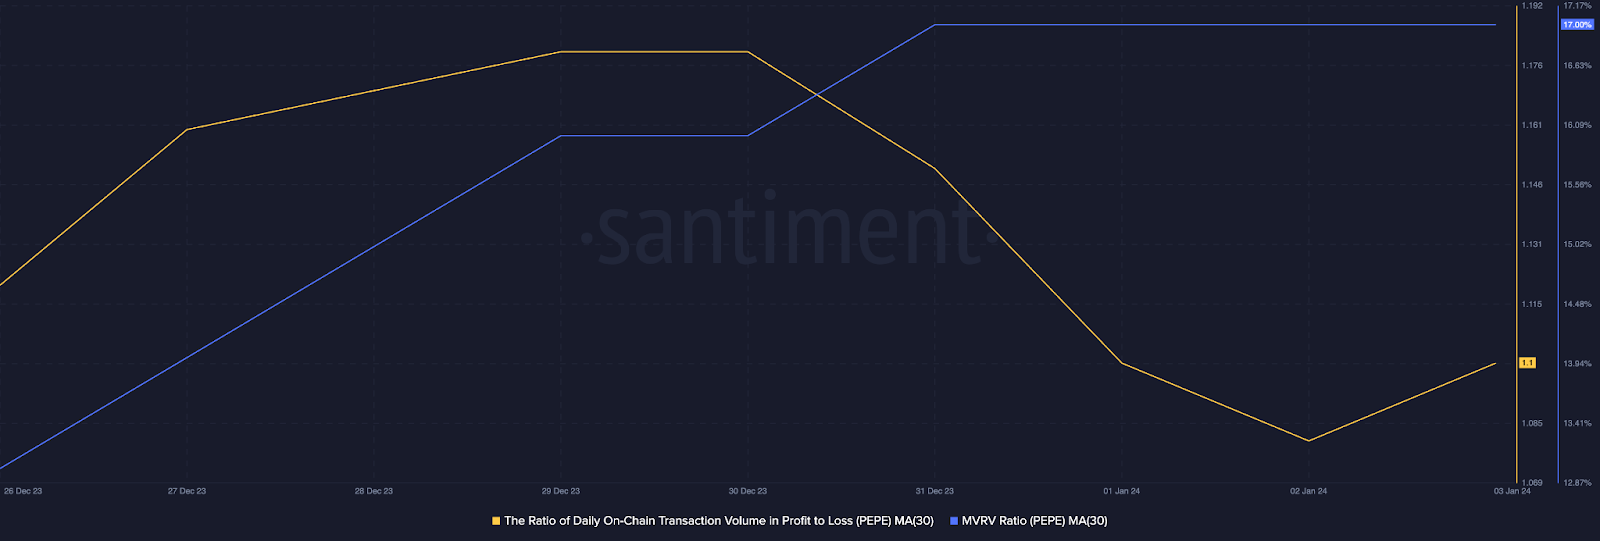
Although recent sell-offs have put pressure on the meme coin’s value, on-chain data reveals that PEPE investors continue to hold at a profit.
According to data from Santiment, the ratio of the token’s daily transaction volume in profit to loss assessed on a 30-day moving average was 1.1. This meant that for every PEPE transaction that ended in a loss, 1.1 transactions returned a profit.
Likewise, the asset’s Market Value to Realized Value (MVRV) ratio observed within the same period was 17%. This suggested that if all PEPE holders sold the tokens at their current price of $0.0000013, they would, on average, record a 16% realized profit.
SHIB is Poised for a Decline
Barely seeing any price growth in the last week, SHIB’s Moving Average Convergence/Divergence (MACD) indicator showed a bearish crossover of the MACD line with the trend line on December 26.
Whenever an asset’s MACD line crosses below its trend line, it suggests the weakening of upward momentum and the start of a downtrend. Since December 28, SHIB’s price has fallen by 9%.
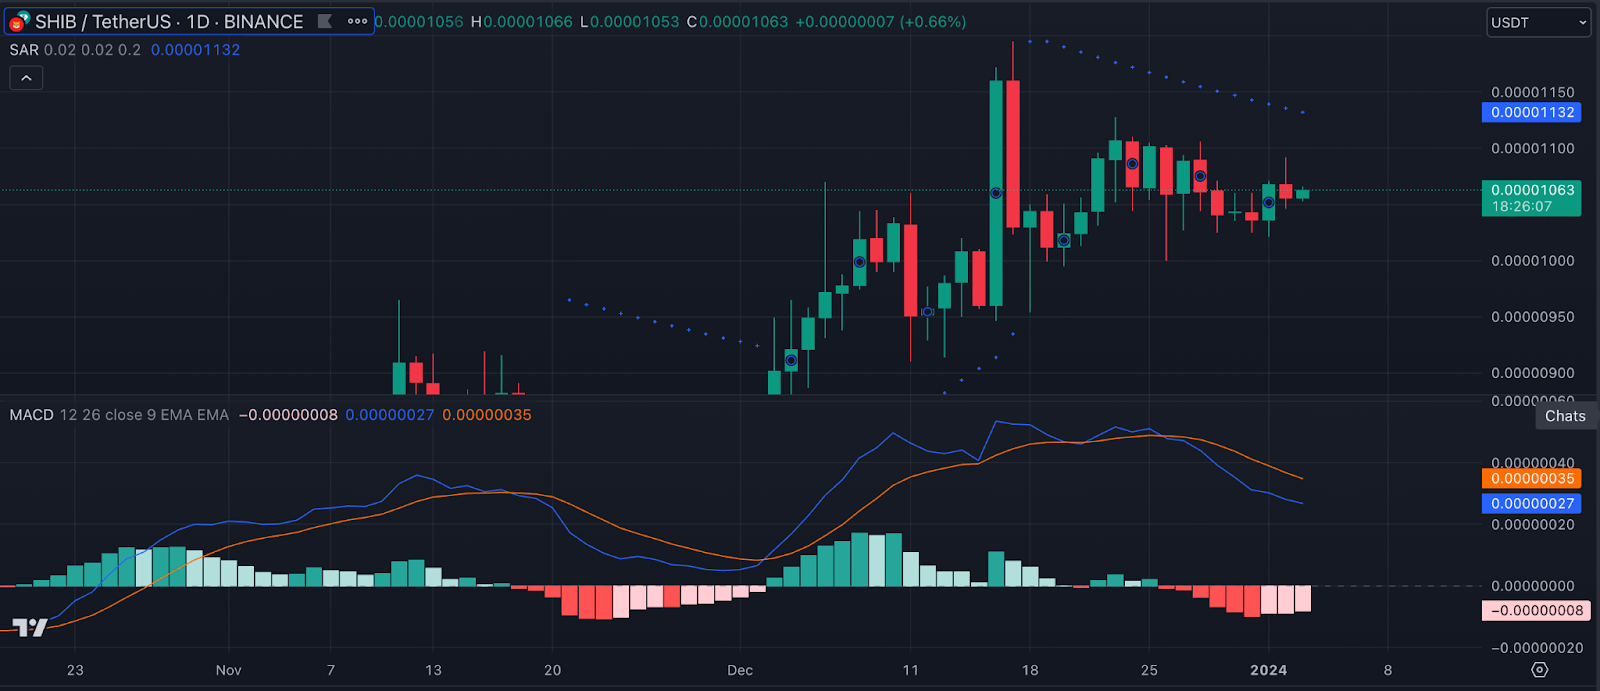
SHIB’s Parabolic SAR indicator with dotted lines above the coin’s price confirmed the decline in buying pressure. This indicator measures trends and potential reversals in asset prices. When its dotted lines rest above an asset’s price, it means that market sentiment is significantly bearish.
Disclaimer: The information presented in this article is for informational and educational purposes only. The article does not constitute financial advice or advice of any kind. Coin Edition is not responsible for any losses incurred as a result of the utilization of content, products, or services mentioned. Readers are advised to exercise caution before taking any action related to the company.

: What Happens If You Use an Unlicensed Platform?")


