


- Bulls outperform bears in the previous 24 hours.
- Despite resistance at $12.31, TORN bulls maintain control.
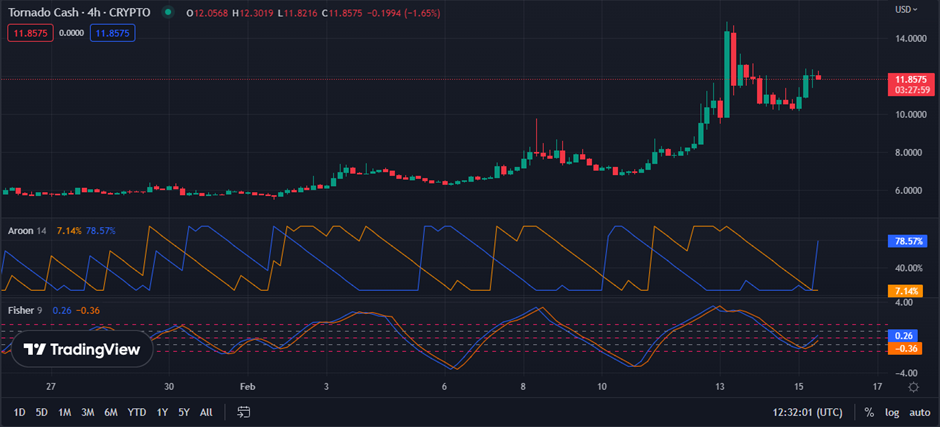
- The Aroon indicator alerts traders to short-term risks.
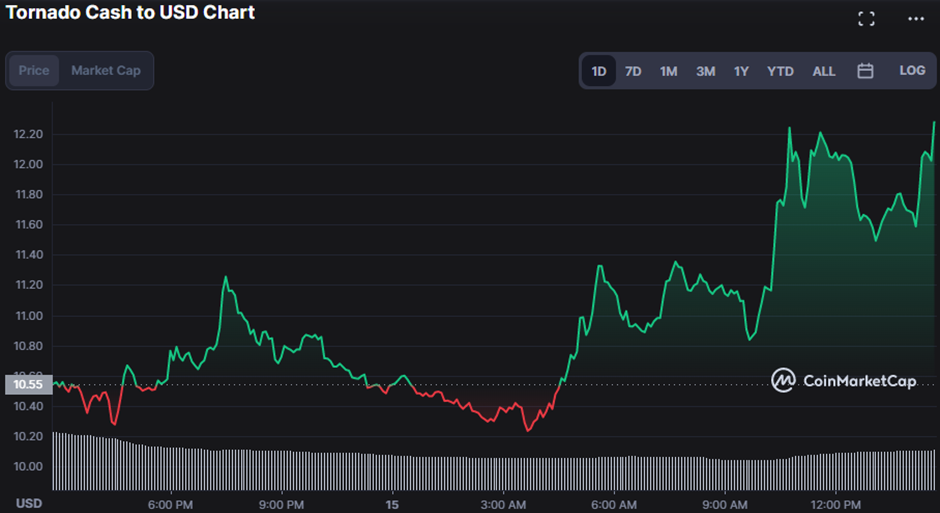
After a few hours of being tossed to and fro between bulls and bears, within a price range of $10.23 to $12.31, the bulls appear to have seized control of the Tornado Cash (TORN) market. This bullish trend was still in effect as of this writing, and the price had risen by 14.28% to $12.08.
While the market cap increased by 14.28% to $13,290,009, the 24-hour trading volume dropped by 29.91% to $30,625,483, suggesting that more people are interested in holding TORN than trading it during the upswing. Demand for holding TORN is high, so the market’s current bullish trend will likely last. The rising market valuation, falling trading volume, and optimistic mood of investors all point to this.
With values of 78.57% and 7.14%, respectively, the Aroon up has lately moved below the Aroon down. The Aroon up measures the strength of an uptrend, while the Aroon down measures the strength of a decline. This change warns traders to be cautious, as the bullish force may wane.
Furthermore, the lack of power in the Aroon up might indicate that the market is losing momentum and is about to reverse, implying that traders should keep a careful watch on future performance as a signal of a likely bearish reversal.
The notion that the Fisher transform is trending above the signal line with a value of 0.26 indicates that the trend is still intact. Despite this, recent Aroon up and down readings may indicate that market conditions are changing and that a potential reversal is on the horizon.
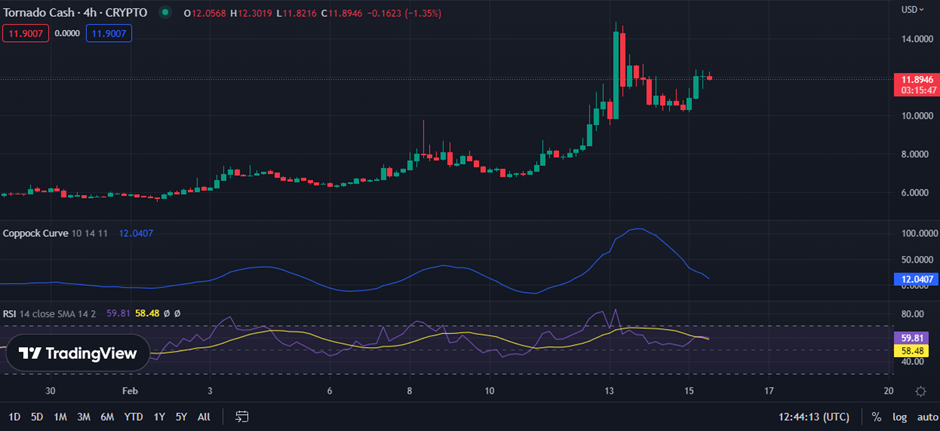
The bullish momentum will continue as the Coppock Curve moves south while remaining in the positive zone with a reading of 11.9742, suggesting that the market is in an uptrend and that investors remain confident in the market’s future.
However, regardless of the present readings, it is crucial to remember that if the Coppock Curve falls below zero and into the negative zone shortly, a bear market may occur. With a reading of 59.68, the Relative Strength Index (RSI) is moving over its signal line, indicating that bullish momentum is strong since values above 50 imply a bullish trend.
If, on the other hand, the RSI goes below its signal line or falls below 50, it may mean that a bear market is approaching. However, despite the need to be aware of these possible threats, current indicators indicate that the market is still up, and investors are confident in its path.
According to technical indicators, bullish momentum will remain as bullish power gains traction.
Disclaimer: The views and opinions, as well as all the information shared in this price analysis, are published in good faith. Readers must do their own research and due diligence. Any action taken by the reader is strictly at their own risk, Coin Edition and its affiliates will not be held liable for any direct or indirect damage or loss.
Disclaimer: The information presented in this article is for informational and educational purposes only. The article does not constitute financial advice or advice of any kind. Coin Edition is not responsible for any losses incurred as a result of the utilization of content, products, or services mentioned. Readers are advised to exercise caution before taking any action related to the company.


