


- XRP’s weekly chart indicated seller exhaustion, suggesting a subsequent upswing.
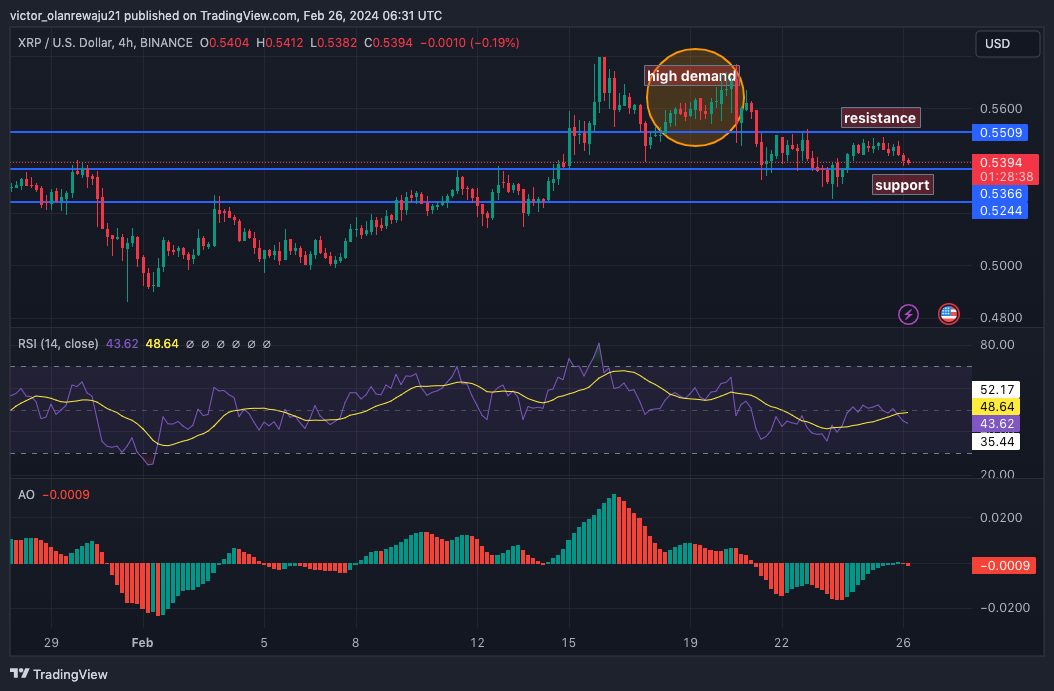
- The RSI and AO readings on the 4-hour timeframe showed bearish momentum.
- A trendline breakout above $0.57 could drive XRP toward $0.65.
According to analyst Ali Martinez, Ripple (XRP) could be on its way to $0.63 or rise higher to $0.65. Martinez mentioned this in a post on X. However, his opinion was not without reason. From the post he shared, the analyst pointed out that the observation from the Tom DeMark (TD) Sequential was responsible for his stance.
Despite the optimistic forecast, Martinez noted that there was a condition attached to it. According to him, XRP needs to close above $0.57 to validate the prediction.
Buyers Aim to Stop the Sell-Offs
For the unfamiliar, the TD Sequential looks for a complete 6 to 9-count price bar to determine bullish or bearish exhaustion. If the price bars are green on the weekly or daily chart, then it might suggest buyer exhaustion.
But in XRP’s case, the bars were red, indicating that sellers are fatigued, and XRP could be set for a bullish reversal. However, the 4-hour timeframe showed a different scenario as the token looked bearish near the $0.53 support.
Should buyers fail to stop the selling onslaught, XRP’s price might decline to $0.52 in the short term. Furthermore, indications from the RSI showed that the previous attempts at sustaining a bullish momentum had been rejected.
Demand Is the Catalyst XRP Needs
If the RSI reading continues to decrease, then the value of the token might slide down to $0.50. However, if XRP retains $0.54 or crosses the $0.55 resistance, the price could head back to $0.57 where there was high demand for the token at one point.
A close above $0.57 could be the stepping stone that leads XRP toward $0.63. On the other hand, if XRP gets rejected at $0.55, the price could end up consolidating between $0.52 and $0.54.
Meanwhile, signals from the Awesome Oscillator (AO) aligned with a move downwards. Previously the AO reading was positive. But at press time, the indicator had slipped into the negative region. Should red histogram bars continue to appear, then the token might race toward new lows.
In a highly bearish condition, XRP could break below $0.57. If this is the case, the price might retest $0.48. Conversely, a highly bullish scenario could increase the likelihood of a trendline breakout. If this happens, XRP’s price might bounce in the $0.65 direction.
Disclaimer: The information presented in this article is for informational and educational purposes only. The article does not constitute financial advice or advice of any kind. Coin Edition is not responsible for any losses incurred as a result of the utilization of content, products, or services mentioned. Readers are advised to exercise caution before taking any action related to the company.


