
- Bullish LTC price prediction for 2026 ranges from $70 to $90.
- LTC could hit $80 in 2026 if LitVM mainnet launches on schedule and the July 2027 halving pre-accumulation window drives buying.
- The bearish LTC price prediction for 2026 is $35.
Litecoin trades at $45.01 today, down 45% year-to-date and 89% below its 2021 all-time high, while on-chain economic throughput has doubled since January; the network processes 180,000+ daily transactions. Clearstream just added regulated LTC custody under MiCA, and LitVM is approaching mainnet after 75 million testnet transactions. The July 2027 halving is 12 months away. A network quietly growing while the price has been crushed is the complete LTC setup going into 2026 through 2030.
What Is Litecoin (LTC)?
Litecoin is a peer-to-peer payment cryptocurrency launched on October 13, 2011, by Charlie Lee, a former Google engineer and ex-Director of Engineering at Coinbase. Built on Bitcoin’s protocol with deliberate modifications for speed and cost, it runs Scrypt proof-of-work, 2.5-minute block times four times faster than Bitcoin, an 84 million coin hard cap, and halvings every 840,000 blocks.
At 92% of max supply already mined, Litecoin is approaching its terminal issuance phase. New supply entering the market is minimal and shrinking. The July 2027 halving cuts the block reward from 6.25 to 3.125 LTC.
Key recent additions to the ecosystem include:
- MWEB: Optional privacy via MimbleWimble Extension Blocks, active since 2022
- LitVM: EVM-compatible ZK-rollup Layer 2 in testnet with mainnet pending audits
- LTC-20: Token standard enabling fungible assets on the Litecoin network
- Lightning Network: Payment channel support for instant, low-cost transfers
- Canary Capital Spot ETF (LTCC): Live on Nasdaq since October 2025, the first US-regulated LTC exposure vehicle and the third crypto asset after BTC and ETH to receive SEC approval
LTC Current Market Status
| Metric | Value |
| Price (July 11, 2026) | $45.01 |
| All-Time High | $410.26 (May 10, 2021) |
| All-Time Low | $1.15 |
| YTD Performance | -45% |
| Market Capitalization | ~$3.46B |
| CMC Rank | #23 |
| 24H Volume | $179.5M |
| Circulating Supply | 77.37M LTC (92% of max) |
| Max Supply | 84,000,000 LTC |
| Daily Transactions | 180,915 |
| Average Transaction Fee | $0.0023 |
| Next Halving | July 27, 2027 |
LTC Price Prediction Overview 2026-2030
| Year | Bearish | Base | Bullish |
| 2026 | $35 to $45 | $45 to $65 | $70 to $90 |
| 2027 | $50 to $80 | $80 to $150 | $180 to $350 |
| 2028 | $60 to $100 | $100 to $200 | $250 to $380 |
| 2029 | $55 to $90 | $80 to $150 | $200 to $400 |
| 2030 | $50 to $80 | $100 to $200 | $300 to $500 |
LTC Price Prediction 2026
EMA, SAR and Weekly Bollinger Bands: Fragile Daily Recovery Inside a Still-Bearish Weekly Structure
The daily EMAs on July 11 show the 20 EMA at $44.10, the 50 EMA at $45.96, the 100 EMA at $49.79, and the 200 EMA at $58.01. The SAR sits at $42.34. At $45.01, LTC trades above the 20 EMA for the first time since May and is pressing against the 50 EMA from below. The SAR below price confirms the daily uptrend signal is technically active, though repeated 50 EMA failures since October 2025 keep that signal fragile.
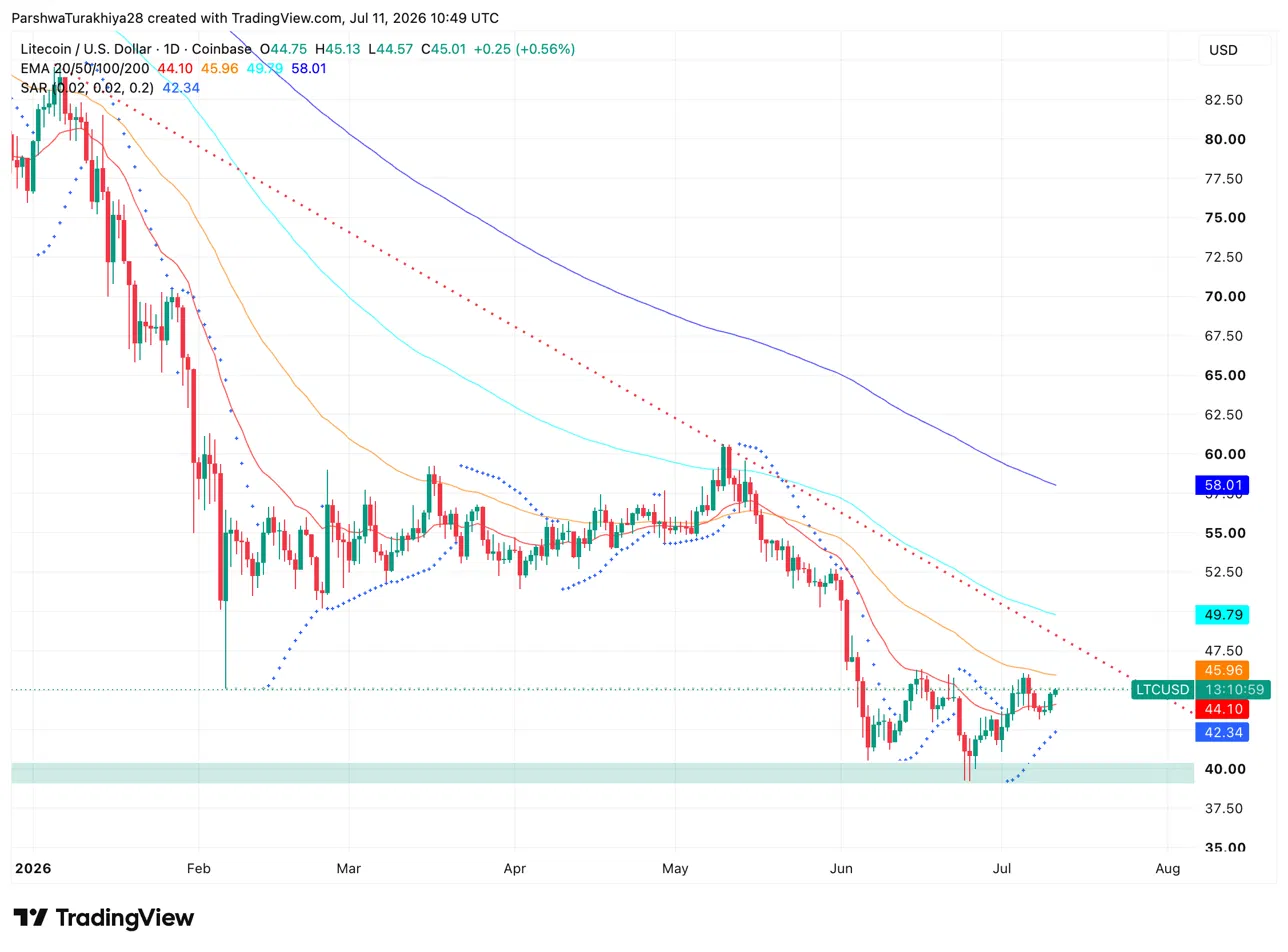
A confirmed daily close above $45.96 opens the 100 EMA at $49.79, the level that acted as support during April to May before breaking down. The 200 EMA at $58.01 is where any meaningful 2026 recovery gets confirmed. A close below SAR at $42.34 flips the trend signal bearish and opens the $40 support zone that held the June lows.
The weekly chart provides the broader context. After months of decline from the $140 January 2026 high, the price pushed through the weekly lower Bollinger Band during the June lows near $37 to $40, then recovered back inside. The lower band at $41.39 is now holding as support. The weekly BB basis at $51.39 is the line that separates range trading from a genuine recovery narrative, and every attempt to reclaim it since December 2025 has failed. The upper band at $61.38 aligns almost exactly with the 200-day EMA at $58.01, making that $58 to $62 zone a convergence of major resistance across timeframes.
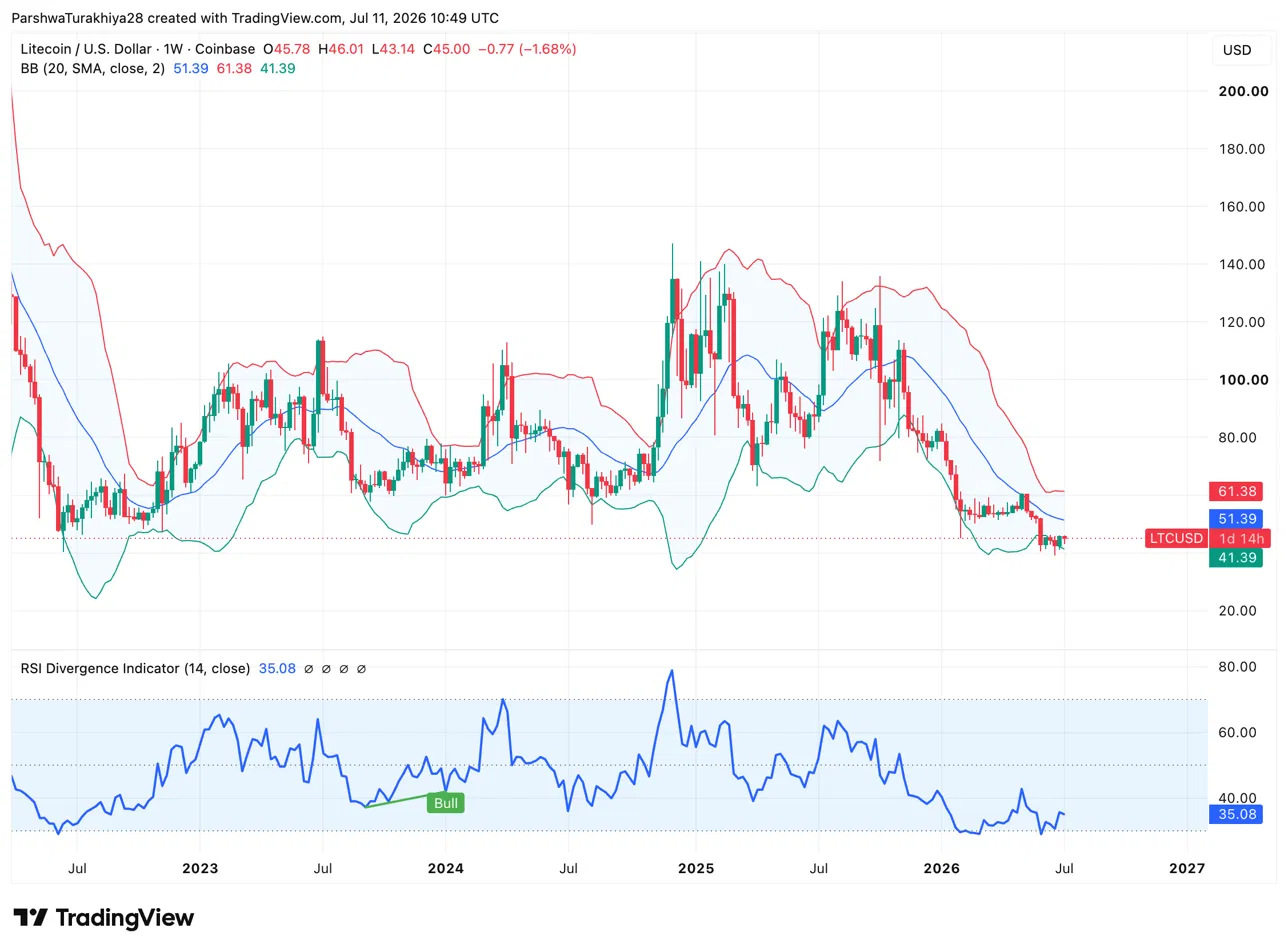
Weekly RSI at 35.08 sits in the same zone where the prior bull divergence signal fired in early 2024 before the H2 2024 rally to $143. No active divergence signal is currently flagged, but one could form if price makes a higher low on the next pullback while RSI holds above the June trough.
Key LTC levels for 2026:
- Resistance: $45.96 (50 EMA), $49.79 (100 EMA), $58.01 (200 EMA), $60 to $62
- Support: $44.10 (20 EMA), $42.34 (SAR), $40.00 (June low), $37.85
LTC 2026 Fundamental Catalysts
LitVM Mainnet Launch
LitVM is the most consequential upcoming event for LTC in years. An EVM-compatible ZK-rollup giving Litecoin smart contracts for the first time, the LiteForge testnet has processed 75 million+ transactions. Every LitVM fee is paid in LTC. If mainnet launches and attracts even modest DeFi TVL from the $72B+ currently locked in on-chain finance, it changes the demand equation for a network that has only ever been a payment chain.
July 2027 Halving Pre-Accumulation
The halving window is 12 months away, and historically, Litecoin’s most meaningful pre-event price action occurs in the 6 to 12 months preceding the halving. That accumulation window begins now. The 2019 pre-halving cycle ran from $22 to $140. The conditions for 2027 are structurally better: a live US spot ETF, European institutional custody, and LitVM, adding a new demand source that did not exist in prior cycles.
Clearstream Institutional Custody
Deutsche Börse’s post-trade arm, adding regulated LTC custody under MiCA, opens LTC to European institutional capital, including pension funds, insurers, and bank trading desks that require MiCA-compliant infrastructure before they can hold an asset. This is the kind of integration that takes months to produce demand flow, but the foundation is now laid for capital pools that previously had no compliant access.
On-Chain Economic Value Doubling
Real on-chain economic throughput has gone from approximately 10 million LTC to 22 million LTC daily since January 2026, a genuine 2x in economic activity on the network while the price fell 45%. Divergences between on-chain usage and price historically resolve in price’s direction over time.
The Honest Assessment
LTC’s 200-day EMA sits at $58 and has been declining throughout 2026. Every meaningful resistance overhead is also declining. The $40 support zone held in June, but the trend structure on every major timeframe remains bearish until price closes above $46 on the daily and $51 on the weekly BB basis on a sustained basis.
The pre-halving narrative is real, but in 2023, the same narrative produced a sell-the-news reaction from much higher levels. The Canary ETF’s $5.49M AUM after eight months is a real signal of where institutional demand currently sits, and the MWEB exploit earlier in 2026, while patched, highlighted ongoing technical risk and potential exchange delisting exposure.
| Scenario | Price Range |
| Bullish | $70 to $90 |
| Average | $45 to $65 |
| Bearish | $35 to $45 |
LTC Price Prediction 2027
2027 is the pivotal year. The July 27 halving cuts block rewards from 6.25 to 3.125 LTC, the fourth Litecoin halving. The pre-halving accumulation window runs roughly from January through July 2027. The 2019 halving preceded a run from $22 to $140. The 2023 halving was a sell-the-news event from approximately $110 that produced no sustained upside.
The 2027 conditions differ from 2023 in two concrete ways. The Canary ETF exists and is accessible to retail and institutional buyers without touching a crypto exchange. LitVM, if it ships in late 2026, gives LTC a new demand driver that no prior halving has had. If LitVM is live and showing growing TVL by mid-2027, the pre-halving narrative layers on top of genuine utility adoption, a combination LTC has never had entering a halving. The bear case assumes LitVM delays, ETF adoption stays minimal, and the halving produces the same sell-the-news dynamic as 2023.
| Scenario | Price Range |
| Bullish | $180 to $350 |
| Average | $80 to $150 |
| Bearish | $50 to $80 |
LTC Price Prediction 2028
2028 is a Bitcoin halving year, the fifth BTC halving. Established altcoins with payment narratives and high liquidity historically capture meaningful capital in the 6 to 12 months following a Bitcoin halving. Litecoin at this point would have completed its own July 2027 halving, be operating LitVM for 12 to 18 months, and have multiple ETF products live in the US and EU. InvestingHaven projects $110 to $275 for 2028, and Coinpedia targets $220 to $380. The base case assumes Litecoin rides the BTC halving tailwind without fully breaking from Bitcoin’s shadow. The bull case requires LitVM to generate real DeFi volume that creates LTC demand independent of Bitcoin cycle positioning.
| Scenario | Price Range |
| Bullish | $250 to $380 |
| Average | $100 to $200 |
| Bearish | $60 to $100 |
LTC Price Prediction 2029
Post-cycle consolidation typically compresses the previous bull run’s gains by 60 to 80% in the year after the Bitcoin halving peak. Litecoin’s own history confirms this: the 2021 peak at $410 was followed by a collapse to $40 by late 2022. LiteFinance’s 2029 model targets an average of $88.85 with a high near $118. Coinpedia projects $290 to $530.
The structural differentiator for 2029 versus prior post-cycle periods is the burn mechanism from LitVM fees. If the Layer 2 is generating real volume, LTC fee burns create a demand floor in a downturn that did not exist in 2022 or 2024. That is a meaningful distinction, but only if LitVM has actually attracted meaningful TVL by then.
| Scenario | Price Range |
| Bullish | $200 to $400 |
| Average | $80 to $150 |
| Bearish | $55 to $90 |
LTC Price Prediction 2030
2030 is a fifth Litecoin halving year, with block rewards dropping from 3.125 to 1.5625 LTC. Stacking a Litecoin halving on top of continued Bitcoin cycle momentum makes this one of the more structurally interesting years on the medium-term calendar.
At 92% of supply already mined today, Litecoin in 2030 will be approaching 98 to 99% of total supply in circulation, near-complete scarcity from a new issuance perspective. The demand side by 2030 depends on whether LitVM created genuine DeFi infrastructure, whether ETF inflows scaled beyond the current $5.49M, and whether Clearstream-style institutional custody expanded to additional regulated markets.
| Scenario | Price Range |
| Bullish | $300 to $500 |
| Average | $100 to $200 |
| Bearish | $50 to $80 |
Conclusion
Litecoin in mid-2026 presents one of the clearest disconnections between network fundamentals and market price in the asset’s 15-year history. On-chain economic throughput doubled in six months. Daily transactions exceed 180,000 at near-zero fees. Clearstream added regulated custody. A US spot ETF is live. LitVM is 75 million testnet transactions deep. The July 2027 halving is 12 months out, precisely the window where historical pre-halving accumulation has produced the most meaningful price action.
Against all of that: the price sits at $45 below four descending daily EMAs, the weekly chart is still pressing the lower Bollinger Band, the ETF has $5.49M in AUM after eight months, and LitVM mainnet has not shipped yet. The 50 EMA at $45.96 on the daily and the weekly BB basis at $51.39 are the two levels that convert the narrative into a chart. Until LTC closes above both on a weekly basis, the 2027 halving thesis is an accumulation story, not a momentum one.
Frequently Asked Questions
At $45, $80 requires a 78% move. The technical path runs through the 50 EMA at $45.96, then the 100 EMA at $49.79, then the weekly BB basis at $51.39, then the 200 EMA at $58.01. Only above $58 is $80 in open air. LitVM mainnet launch is the catalyst that could drive that move in a single, sustained leg. Without it, the pre-halving narrative builds slowly, and $80 is more likely a 2027 story than a 2026 one.
Average $80 to $150, bullish $180 to $350 if the July 2027 halving produces a pre-event rally similar to the 2019 cycle, which ran from $22 to $140 in the 12 months preceding the event. The bear case at $50 to $80 assumes a repeat of the 2023 halving’s sell-the-news dynamic. The conditions in 2027 are meaningfully better than in 2023, with a live ETF, European institutional custody, and potentially LitVM adding a new demand driver.
LitVM is an EVM-compatible ZK-rollup Layer 2 that adds smart contract functionality to Litecoin without altering its base layer. The testnet processed 75 million+ transactions with every LitVM fee paid in LTC, creating new demand from DeFi activity. Over $72 billion sits in on-chain finance today, and almost none of it has ever run on Litecoin because it lacked smart contracts. LitVM is the product that changes that, making it the most significant development in Litecoin’s history since its 2011 launch.
Adjusted Economic Value on the Litecoin network doubled in the first half of 2026, from approximately 10 million to 22 million LTC in real economic throughput daily, while the price fell 45% over the same period. That divergence between usage and price is explained primarily by broader altcoin market weakness and a lack of new narratives capturing market attention. Legacy payment coins have broadly underperformed newer infrastructure tokens in 2026. The 2027 halving and LitVM are the two catalysts that could close that gap.
Clearstream, Deutsche Börse Group’s post-trade arm and one of Europe’s largest settlement infrastructure providers, added regulated Litecoin custody under MiCA in July 2026. This gives European institutional investors, including banks, pension funds, and fund managers, a MiCA-compliant gateway to hold LTC without using a crypto-native exchange. The demand effect is gradual rather than immediate, but it represents infrastructure that opens LTC to capital pools that previously had no compliant access.
The 2019 pre-halving cycle ran approximately 6x in the 12 months before the event. The 2023 halving was a sell-the-news event from approximately $110 with minimal sustained upside. The 2027 conditions are more similar to 2019 than 2023: Litecoin enters it at depressed prices after a multi-year decline with new institutional infrastructure in place. Whether it becomes a buy or sell event depends primarily on whether Bitcoin is in an uptrend through H1 2027 and whether LitVM has launched and is showing usage by then.
Disclaimer: The information presented in this article is for informational and educational purposes only. The article does not constitute financial advice or advice of any kind. Coin Edition is not responsible for any losses incurred as a result of the utilization of content, products, or services mentioned. Readers are advised to exercise caution before taking any action related to the company.