


- LTC decreased by 12.80% in the last 30 days in contrast to the previous pre-halving performance.
- If the 50 EMA flips the 20 EMA, then LTC might fall below $90 unless buying pressure increases.
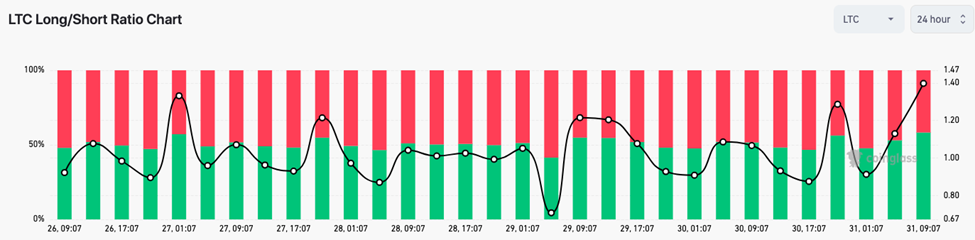
- Long positions outweighed shorts, suggesting a bullish sentiment in the aftermath of the halving.
As Litecoin (LTC), approaches its third halving event, discussions have risen on whether history will repeat itself in terms of price performance. For context, the halving happens every four years, and it’s a process where miners get rewards for validating transactions.
Historically, LTC goes on a pre-halving rally before the price falls a few days after the event. According to CoinMarketCap, this was the case prior to the August 5 2019 halving. Around this period, LTC grew from $88 around July to trade above $120 on the halving day.
LTC Is Not In Tune with History
However, as one of the pioneering cryptocurrencies, LTC has not had the same move this cycle. As mentioned above, past halvings have been associated with significant price rallies. But there are compelling factors suggesting that this time might be different.
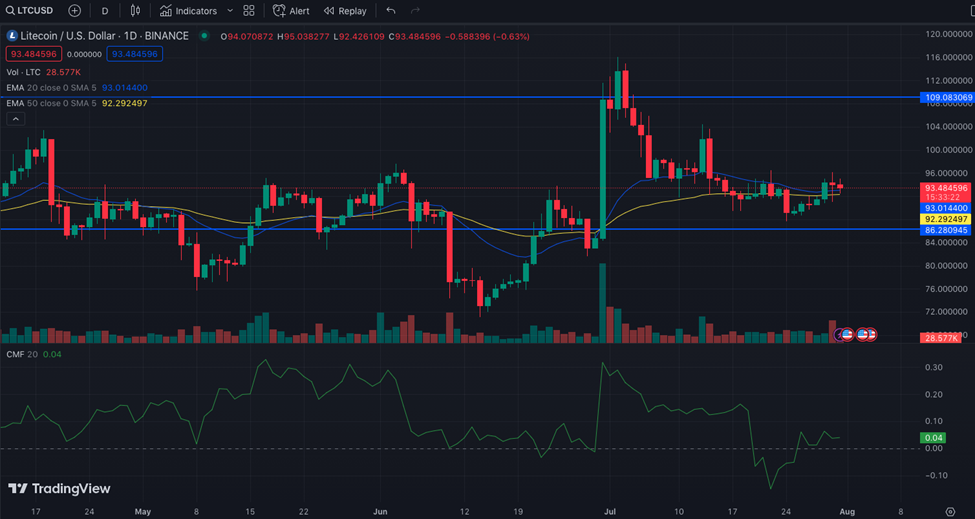
For instance, the coin price was $93.29 — a 12.80% decrease in the last 30 days. At the time of writing, LTC did not show any strong sign of crossing the $100 psychological level.
Ahead of the event, the coin’s market structure pushed toward a mixed signal instead of a bullish or bearish bias. This deduction was because of the Exponential Moving Average (EMA) stance on the daily LTC/USD chart.
On July 30, the 20 EMA (blue) crossed the 50 EMA (yellow). Usually, this is a bullish signal and was reinforced by a strong buy candle to $109.08. However, bullish dominance did not last long, prompting an array of sell pressure that drove LTC to $93.36.
Traders Believe In a BreakOut
Furthermore, the 50 EMA had closed in on the 20 EMA. If the 50 EMA eventually flips the 20 EMA, then LTC might lose hold on the $90 region.
Meanwhile, the Chaikin Money Flow (CMF) was 0.04. Since the CMF was above zero, it implies strength in the market. But the indicator would need more buying pressure to confirm a breakout in the upward direction.
As it stands, the declining volume and the consolidating momentum revealed that an upward spike could be unlikely.
Despite the signals displayed by the technical indicators, traders seemed bullish on the LTC price action. According to Coinglass, the LTC 24-hour long/short ratio had increased to 1.39.
A long/short ratio exceeding 1 suggests a higher prevalence of long positions. Conversely, if the indicator is below one, then it means that short positions were higher. So, LTC open positions in the derivatives market suggest a positive sentiment
In conclusion, there’s a high chance that LTC fails to rise above $100 before the halving. But considering traders’ position, the coin could rally a few weeks after the event provided sellers do not stamp their dominance over buyers.
Disclaimer: The views, opinions, and information shared in this price prediction are published in good faith. Readers must do their research and due diligence. Any action taken by the reader is strictly at their own risk. Coin Edition and its affiliates will not be liable for direct or indirect damage or loss.
Disclaimer: The information presented in this article is for informational and educational purposes only. The article does not constitute financial advice or advice of any kind. Coin Edition is not responsible for any losses incurred as a result of the utilization of content, products, or services mentioned. Readers are advised to exercise caution before taking any action related to the company.


