


- After resistance at a 30-day high, the MATIC market is pessimistic.
- As bulls battle, indicators point to a bullish trend on the horizon.
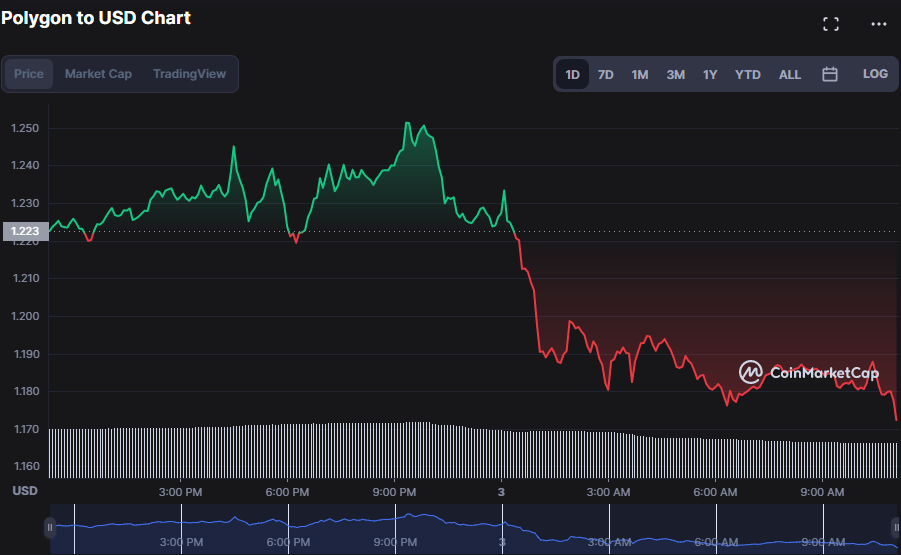
- During the slump, MATIC’s price fluctuated between $1.17 and $1.25.
Earlier in the day, bulls maintained control of Polygon (MATIC), driving the price to a 30-day high of $1.25. However, due to the bulls’ reluctance to face resistance, the bears seized the market and managed to drop the price to a low of $1.17 (4.12% drop).
Fearing further price declines, traders exited the market, reducing market capitalization and 24-hour trading volume by 4.12% to $10,237,734,688 and 28.62% to $633,662,491.
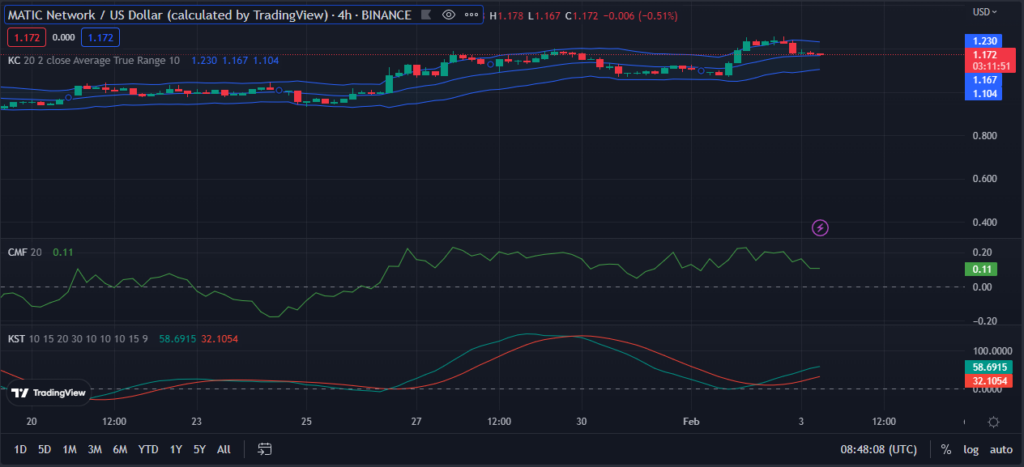
The linear motion of the Keltner Channel bands, with the upper band at $1.230 and the lower band at $1.104, exemplifies the bearish run in the MATIC market. This movement indicates that market sentiment is overwhelmingly bearish, as the upper band has been steadily descending while the lower band has remained nearly flat. In addition, demand for MATIC has significantly weakened, suggesting that the market is under selling pressure. However, since the price is moving above the signal line, it is conceivable that the general selling pressure is easing, and the MATIC market is starting a phase of recovery.
With a reading of 58.8458, the Know Sure Thing (KSI) indicator points north and goes over its signal line, bolstering the market’s recovery. This positive reading on the KSI indicator suggests that MATIC is forming a base and that traders will soon buy back into the market.
The bearish hand in the MATIC market is weakening, and the bullish momentum is beginning to take control, with a Chaikin Money Flow (CMF) reading of 0.11 and moving sideways. As these positive indications start to converge, MATIC is approaching a tipping point and entering a period of expansion.
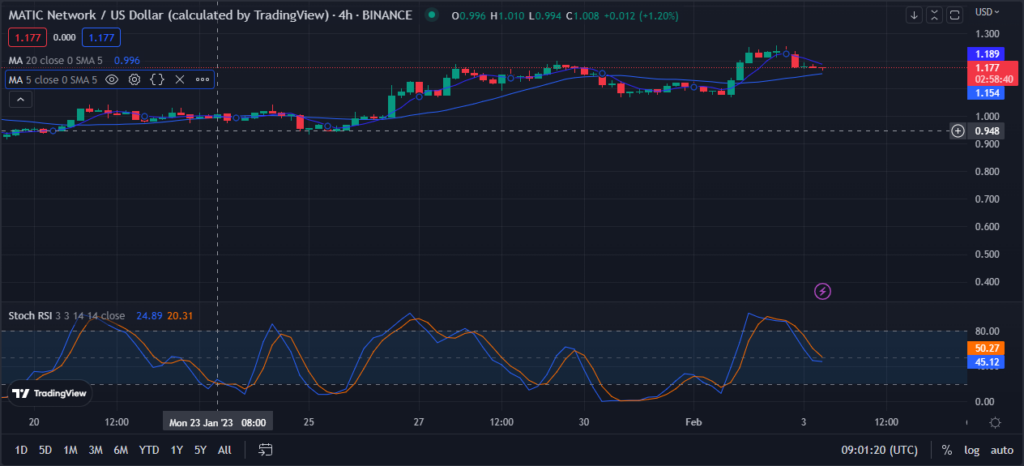
The movement of the 5-day MA above the 20-day MA ( (bullish crossover) with values of 1.188 and 1.154 reflects the bullish restart in the MATIC market. This shift indicates buyers have become more aggressive, and a strong bullish trend is likely shortly. In addition, the 5-day moving average points south, while the 20-day moving average points north, indicating that buyers have become more active and that there may be more upside potential in the MATIC market.
The stochastic RSI value of 44.02 and its movement below its signal line imply that the MATIC market is experiencing short-term negative momentum. If the stochastic drops into the oversold level of “30,” a bullish reversal is possible. Additionally, given the current trend of increased buying pressure and the bullish MA crossover, a bullish trend is coming soon.
If the MATIC market is to undergo a correction, bulls need to keep pushing prices above the current resistance level.
Disclaimer: The views and opinions, as well as all the information shared in this price analysis, are published in good faith. Readers must do their own research and due diligence. Any action taken by the reader is strictly at their own risk, Coin Edition and its affiliates will not be held liable for any direct or indirect damage or loss.
Disclaimer: The information presented in this article is for informational and educational purposes only. The article does not constitute financial advice or advice of any kind. Coin Edition is not responsible for any losses incurred as a result of the utilization of content, products, or services mentioned. Readers are advised to exercise caution before taking any action related to the company.


