


- Meta stock fell more than 10% and headed for its largest daily decline since October 2025, The Kobeissi Letter said.
- Meta erased about $175 billion in market value after its Q1 earnings report.
- GraniteShares’ FBL offers 2x daily long exposure to META, with material risk for intraday traders.
Meta Platforms shares fell sharply after the company’s Q1 earnings report, with $META dropping more than 10% on the day. The Kobeissi Letter reported that the move put Meta on track for its largest daily decline since October 2025, while the stock erased about $175 billion in market value.
The selloff also drew attention from WatcherGuru, who posted that META had lost about $175 billion in market cap. Notably, analyst Barchart added that Meta dropped below its 200-day moving average. Meanwhile, traders also tracked GraniteShares’ 2x Long META Daily ETF, FBL, as intraday volatility increased around the stock.
Meta Selloff Follows Earnings
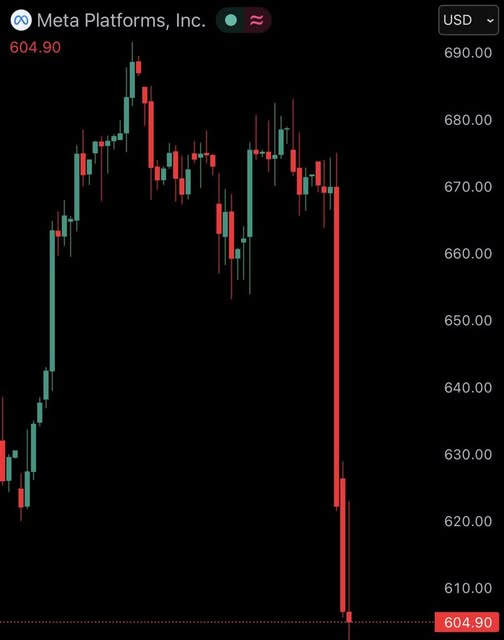
Meta’s post-earnings move turned into one of the stock’s sharpest daily declines in months. The Kobeissi Letter said the stock extended losses to more than 10% during the session, with the chart showing META near the $600 area after a steep intraday drop.
The chart posted by Kobeissi showed a sudden breakdown from the upper $660 range toward $600.33. That move followed a period of sideways trading earlier in the session before sellers drove the stock lower in a fast decline.
Source: X
Barchart also reported heavy pressure in Meta shares, saying the company lost about $170 billion in market value. However, the main pitch placed the total market cap wipeout at about $175 billion following the Q1 earnings report.
Notably, the decline came after Meta had traded close to the high-$600 range earlier in the day. The sharp fall moved the stock away from that area and placed short-term focus on whether buyers could defend the $600 zone.
Analyst Chart Breaks Key Average
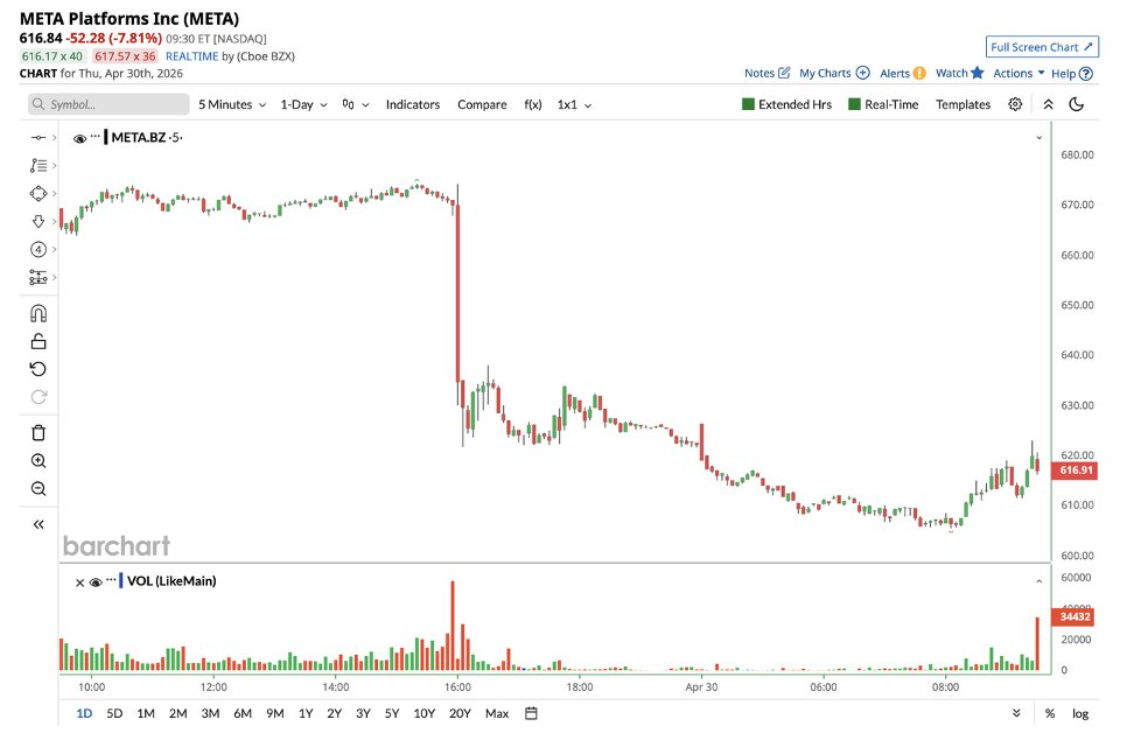
Analyst Barchart’s daily chart showed META falling below its 200-day moving average after the earnings-driven selloff. The chart placed the 200-day line near the upper $670 area, while the stock traded near the low $600s during the move.
That break marked a technical shift because the 200-day moving average often acts as a major trend reference for large-cap stocks. Nevertheless, the chart only showed the price break and did not confirm any longer-term trend change.
Source: X
The five-minute chart shared by Barchart showed the decline starting with a large candle lower after the stock traded near $670. After the first drop, META moved into a lower range, then attempted a partial rebound from near the $605 area.
Additionally, the same intraday chart showed elevated volume during the selloff. Later candles showed META trading around $616.91, still well below the level seen before the earnings reaction.
FBL Data Draws Trader Attention
Barchart also posted about GraniteShares 2x Long META Daily ETF, ticker FBL, as META moved again during intraday trading. The post said the product offers amplified daily exposure for traders using META momentum.
According to GraniteShares, FBL seeks daily investment results, before fees and expenses, equal to 2 times the daily percentage change of Meta Platforms’ common stock. The fund does not guarantee that it will meet the stated objective.
GraniteShares also states that FBL should not be expected to deliver 2 times META’s cumulative return for periods longer than one day. That structure makes the product focused on daily moves rather than longer holding periods.
The fund’s fact summary lists Meta Platforms as the underlying stock and shows a 2x leveraged factor. As of April 29, 2026, FBL had a NAV of $30.8957, a closing price of $30.9900, a 0.31% premium, and a 1.09% net annual expense ratio.
Related: Wasabi Protocol Suffers Over $5M Loss in Multi-Chain Exploit
Disclaimer: The information presented in this article is for informational and educational purposes only. The article does not constitute financial advice or advice of any kind. Coin Edition is not responsible for any losses incurred as a result of the utilization of content, products, or services mentioned. Readers are advised to exercise caution before taking any action related to the company.
 Price Prediction 2026, 2027, 2028, 2029, 2030 -2050")


