
- Nexo has surged by 16.6% in the last seven days and is currently trading at $0.728.
- The key support for NEXO is present at $0.70 as during the past seven days
- Bulls are targeting $0.8 as the next major resistance.
Nexo (NEXO) has surged by 16.6% in the last 7 days, defying a general decline in the crypto market. The coin is currently trading at $0.728 and is forming a bullish continuation pattern. The key support for NEXO is present at $0.70 and currently, the bulls are targeting $0.8 as the next major resistance.
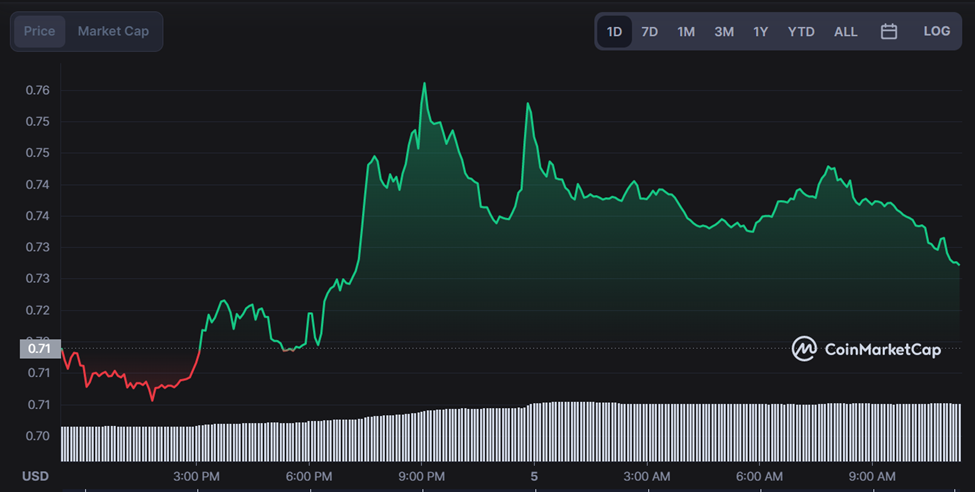
Nexo is trading at $0.727, with a trading volume of $12,582,322, and is up 68.15% in the last 24 hours. The NEXO/USD pair has broken out from a bullish continuation pattern formed between Dec 29 and January 3. More investors are coming to the market and the combination of buying pressure and bullish momentum could push the price further.
The daily chart for NEXO/USD shows a strong support level present at $0.7, which has held several times in the past few days. The current uptrend, if sustained, could lead to a breakout above the $0.8 resistance.
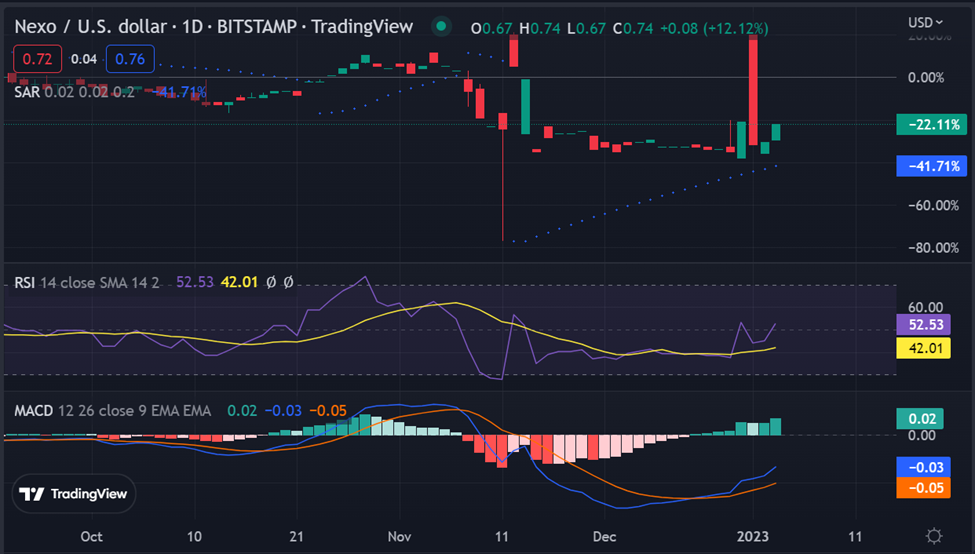
Technical analysis suggests further upside for Nexo as the Relative Strength Index (RSI) is currently trending over a reading of 50 and line is titling upwards, indicating the market may turn overbought in the near future. The Moving Average Convergence Divergence (MACD) indicator shows a bullish crossover and the MACD line is consistently above the signal line, highlighting the positive momentum in Nexo’s price.
The Stochastic Oscillator (SO) is currently hovering at 75, which indicates that the market is overbought and a pullback can be expected soon. The Chaikin Money Flow (CMF) also highlights increased buying pressure with its current reading of 0.15.
The 4-hour chart for NEXO/USD shows that the buyers have been able to sustain their push above $0.7, with the price forming higher highs and higher lows. However, in order for the bulls to maintain their dominance, they need to break out above $0.8 and target $1 as the next major resistance.
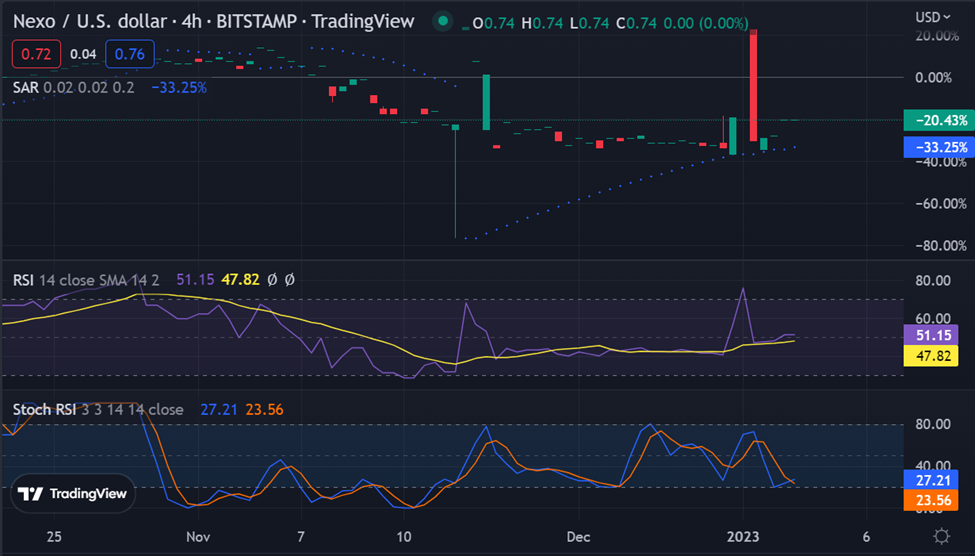
The moving averages are also trending in favor of the bulls, with the 20-period SMA (simple moving average) above the 50-period SMA. The MACD line has crossed over the signal line and is gaining strength, suggesting further upside for NEXO’s price.
Overall, Nexo appears to be forming a bullish continuation pattern on both the daily and 4-hour charts. As long as the buyers are able to sustain their push above $0.7, we can expect further upside in NEXO’s price. The next major resistance is at $0.8 and traders should be aware of that level before making any trading decisions.
Disclaimer: The views and opinions, as well as all the information shared in this price prediction, are published in good faith. Readers must do their research and due diligence. Any action taken by the reader is strictly at their own risk. Coin Edition and its affiliates will not be held liable for any direct or indirect damage or loss.
Disclaimer: The information presented in this article is for informational and educational purposes only. The article does not constitute financial advice or advice of any kind. Coin Edition is not responsible for any losses incurred as a result of the utilization of content, products, or services mentioned. Readers are advised to exercise caution before taking any action related to the company.


 Price Prediction: UNI Eyes $5 as UNI Extends Bullish Breakout")
