


 Price Prediction 2023-2030: Will OXT Price Reach $1 Soon?")
- Bullish OXT price prediction ranges from $0.4468 to $0.5352.
- OXT price might also reach $0.7 this 2023.
- OXT’s bearish market price prediction for 2023 is $0.0508.
With a mission of upholding users’ privacy and enhancing its security, Orchid hopes to create a brighter, freer, and more empowered future. Moreover, by utilizing the features of decentralization, Orchid aims to combine the privacy and freedom of users.
OXT, the native token of Orchid, acts as a staking asset for the VPN market. This ERC-20 digital asset allows providers to compete for user payment flow by staking OXT. The native token of Orchid could also be added and staked by providers to capture additional bandwidth sales on the network.
Let’s now understand about Orchid and the various features of this network. Moreover, this article will conduct a comprehensive analysis of Orchid and forecast the price for 2023, 2024, 2025, 2026, till 2050.
Table of contents
- Orchid (OXT) Market Overview
- What is Orchid (OXT)?
- Orchid (OXT) Current Market Status
- Orchid (OXT) Price Analysis 2023
- Orchid (OXT) Price Prediction 2023-2030 Overview
- Orchid (OXT) Price Prediction 2023
- Orchid (OXT) Price Prediction 2024
- Orchid (OXT) Price Prediction 2025
- Orchid (OXT) Price Prediction 2026
- Orchid (OXT) Price Prediction 2027
- Orchid (OXT) Price Prediction 2028
- Orchid (OXT) Price Prediction 2029
- Orchid (OXT) Price Prediction 2030
- Orchid (OXT) Price Prediction 2040
- Orchid (OXT)Price Prediction 2050
- Conclusion
- FAQ
- More Crypto Price Predictions:
Orchid (OXT) Market Overview
HTTP Request Failed... Error: file_get_contents(https://pro-api.coinmarketcap.com/v2/cryptocurrency/quotes/latest?slug=orchid-protocol): Failed to open stream: HTTP request failed! HTTP/1.1 429 Too Many Requests
What is Orchid (OXT)?
Orchid defines itself as a decentralized virtual private network (VPN) allowing users to buy bandwidth from a decentralized pool of service providers. The native token of Orchid could empower and secure this new approach to VPN service and is one of the core components of the Orchid network.
One of the primary functions of OXT is to provide a staking-advertising mechanism. Moreover, the ERC-20 token also allows providers to earn rewards depending on the OXT staked by them. Users can also pay for a private and secure internet connection using nano payments.
Apart from OXT, Orchid consists of other core components — Orchid app, Orchid Accounts, Orchid Protocol, Nanopayments, Programmable, and Staking. For instance, the Orchid Protocol is designed to use a custom VPN protocol, similar to OpenVPN or WireGuard. Designed for high performance, the Orchid Protocol runs on top of WebRTC, a common web standard.
Orchid explains that this protocol could allow users to request access to remote network resources and pay for these resources using cryptocurrencies via the Orchid nano payments system.
Orchid (OXT) Current Market Status
At the time of writing, OXT has been trading near its intra-day high of $0.0973 while it continues to maintain a distance from its intra-day low of $0.07549. After the native token of orchid observed a surge of 9.18% in one-day, OXT’s market cap is valued at $86,419,388, according to CoinMarketCap.
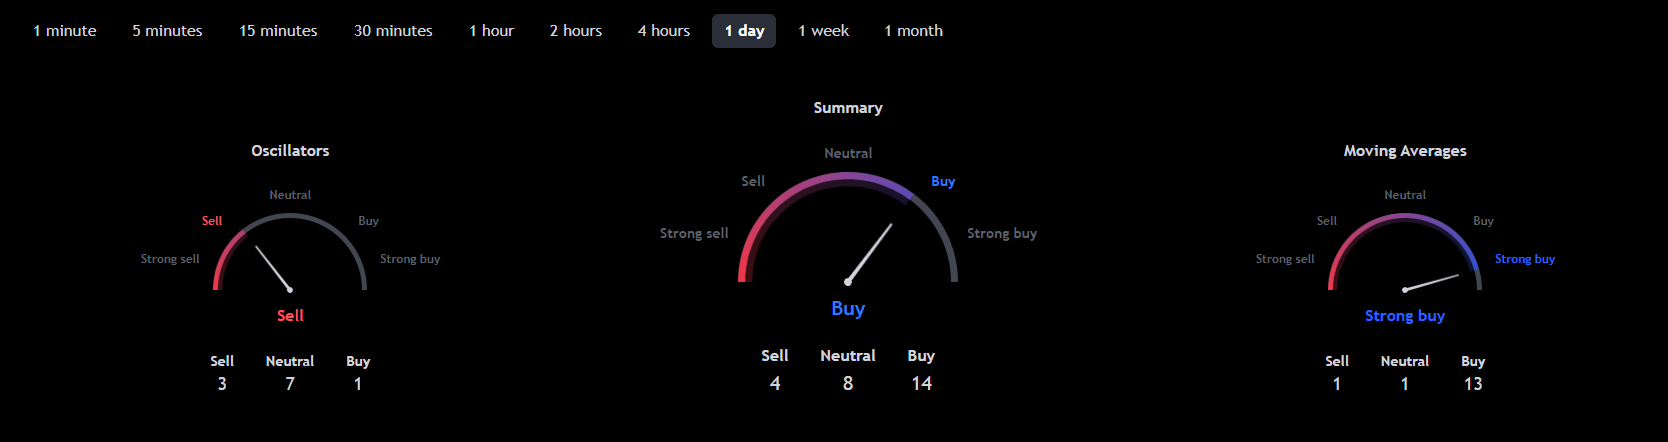
Furthermore, over the seven-day period, OXT also experienced a 74.52% pike, pushing the ERC-20 into the green region. Moreover, TradingView’s market summary also indicates that the buyers could be experiencing a buy sentiment over the one-day period. Let us utilize the technical indicators to further understand the market.
Orchid (OXT) Price Analysis 2023
Will developments and upgrades within the Orchid network drive the price of OXT upwards? Could OXT climb up and break the resistance level? Could it reach a new All-Time High over a short span of time?
Orchid (OXT) Price Analysis – Bollinger Bands
The Bollinger Bands is a technical analysis tool that is used to analyze price movement and volatility. Bollinger Bands (BB) utilizes the time period and the stand deviation of the price. Normally, the default value of BB’s period is set at 20. The upper band of the BB is calculated by adding 2 times the standard deviations to the Simple Moving Average (SMA), while the lower band is calculated by subtracting 2 times the standard deviation from the SMA. Based on the empirical law of standard deviation, 95% of the data sets will fall within the two standard deviations of the mean.
Looking at the Bollinger bands, the bands have expanded indicating that OXT could be experiencing a high volatility. Moreover, the bands’ expansion could be caused by the latest observed by OXT. The BBW also identifies that the bands may continue to expand as it is pointed upwards. However, there may be a chance for a downfall, since candlesticks tend to retrace after an extremely bullish sentiment.
Orchid (OXT) Price Analysis – Relative Strength Index (RSI)
The Relative Strength Index (RSI) is a momentum indicator utilized to find out the current trend of the price movement and determine if it is in the oversold or overbought region. Traders often use this tool to make decisions about when to buy or sell the tokens. When the RSI is often valued below or at 30, it is considered an oversold region, and a price correction could happen soon. Moreover, when the RSI is valued above or at 70, it is regarded as the overbought region, and traders expect the price could fall soon.
The RSI is valued at 81.99 which is clearly the overbought region. There could be a chance that the candlesticks may have experienced caused by buyers’ optimistic behavior. The buyers’ entry into the market also helped the bull come back into power. Ideally, when the RSI hits the overbought region, there may be a chance that prices could retrace. With a similar belief and RSI pointed downwards, we could expect that the RSI may fall.
Orchid (OXT) Price Analysis – Moving Average Convergence Divergence (MACD)
The Moving Average Convergence Divergence (MACD) indicator can be used to identify potential price trends, momentums, and reversals in markets. MACD will simplify the reading of a moving average cross easier. The MACD indicator is calculated by subtracting the long-term EMA (Exponential Moving Average) indicator from the short-term EMA. Normally, the default values for the MACD are set at 12-day EMA, 26-day EMA, and 9-day EMA. Moreover, MACD is considered a lagging indicator as it cannot provide trade signals without any past price data. MACD plays an important role as it can confirm the trends and identify potential reversals.
The MACD continues to form green bars on the histogram model, which could be a sign that OXT could be experiencing a bullish signal. Moreover, the candlesticks climbing up beyond the 200SMA could further indicate that the bullish sentiment in the market still prevails. It is expected that even if OXT falls, there may be a slight chance that the 200SMA current position could act as a support.
Orchid (OXT) Price Prediction 2023-2030 Overview
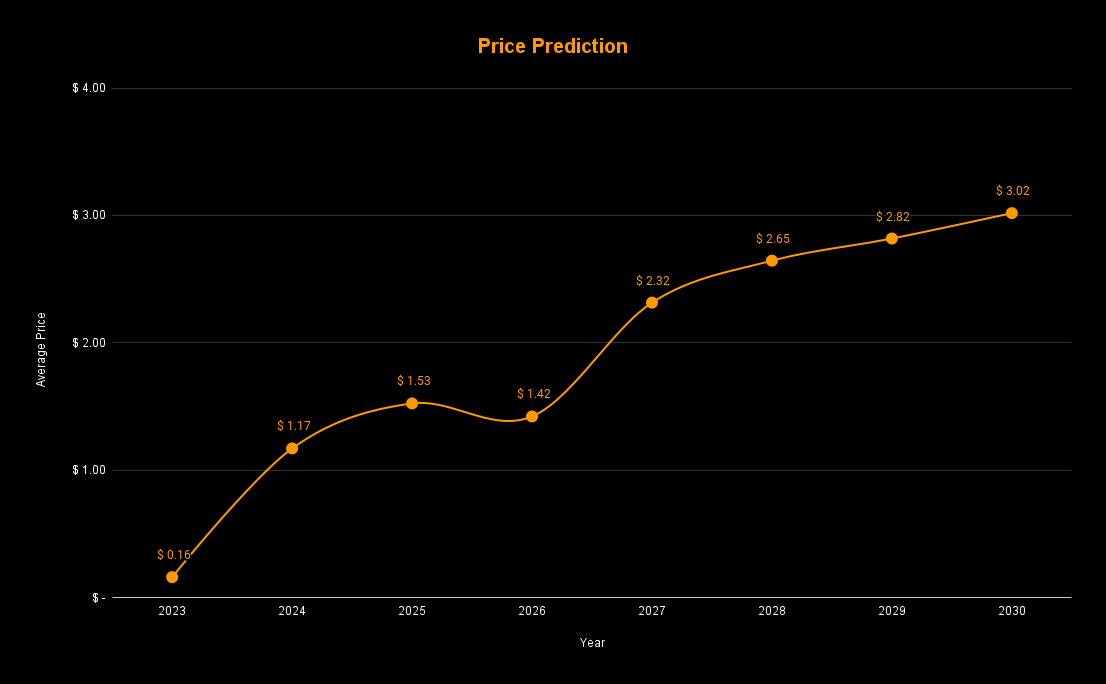
| Year | Minimum Price | Average Price | Maximum Price |
| 2023 | $0.0562 | $0.162 | $0.5352 |
| 2024 | $1.002 | $1.172 | $1.227 |
| 2025 | $1.402 | $1.525 | $1.636 |
| 2026 | $1.272 | $1.423 | $1.857 |
| 2027 | $2.261 | $2.316 | $2.417 |
| 2028 | $2.573 | $2.645 | $2.728 |
| 2029 | $2.718 | $2.819 | $3.0192 |
| 2030 | $2.917 | $3.0182 | $3.223 |
| 2040 | $9.561 | $10.475 | $11.378 |
| 2050 | $24.184 | $25.720 | $26.013 |
Orchid (OXT) Price Prediction 2023
OXT may have been trading downtrend within the regression line, however, it seems a breakout happens. Although an imminent breakout was about to happen, the candlesticks shot up above the 200SMa. Moreover, the Bull vs Bear Power shows that the buyers were one of the main reasons behind this surge. Currently, the ADX continues to grow after being valued at 59 while the sellers are more than the buyer. There may be a chance for a fall over time.
Meanwhile, the forecast for OXT remains to be bullish and is expected to reach beyond the level of $0.4. The bearish price prediction for OXT ranges from $0.0508 to $0.0362. However, on the off chance, OXT experiences an extremely bullish sentiment again, there is a high possibility that it trade beyond the level of $0.7.
| Bullish Price Prediction | Bearish Price Prediction |
| $0.4468 – $0.5352 | $0.0362 – $0.0508 |
Orchid (OXT) Price Prediction 2023 – Resistance and Support
Looking at the charts, the candlesticks is currently residing below the Resistance 1 region. If it continues to experience a bullish trend it has the potential to cross beyond the Resistance 1 region. An extremely bullish trend could push the altcoin beyond the resistance 2. Each resistance passed could become the new support levels for OXT.
Orchid (OXT) Price Prediction 2024
Traders are looking forward to this year as it could be a historic moment for cryptocurrencies, as the Bitcoin halving is expected to happen in 2024. Most of the time, whenever BTC rises, traders have observed a similar surge in the altcoins. OXT could also be affected by Bitcoin halving and could trade beyond the price of $1.2 by the end of 2024.
Orchid (OXT) Price Prediction 2025
OXT could still experience the after-effects of the Bitcoin halving and is expected to trade above its 2024 price. Many trade analysts speculate that BTC halving could create a huge impact on the crypto market. Moreover, similar to many altcoins, OXT will continue to rise in 2025 forming new resistance levels. It is expected that OXT would trade beyond the $1.6 level.
Orchid (OXT) Price Prediction 2026
It is expected that after a long period of bull run, the bears would come into power and start negatively impacting the cryptocurrencies. During this bearish sentiment, OXT could tumble into its support region of $98. Moreover, when OXT remains in the oversold region, there could be a price correction soon. OXT, by the end of 2026, could be trading beyond the $1.8 resistance level after experiencing the price correction.
Orchid (OXT) Price Prediction 2027
Naturally, traders expect a bullish market sentiment after the crypto industry was affected negatively by the bears’ claw. OXT is expected to rise after its slumber in the bear season. Moreover, OXT could even break more resistance levels as it continues to recover from the bearish run. Therefore, OXT is expected to trade at $2.4 by the end of 2027.
Orchid (OXT) Price Prediction 2028
Once again, the crypto community is looking forward to this year as there will be a Bitcoin halving. Alike many altcoins, OXT will continue to form new higher highs and is expected to move in an upward trajectory. Hence, OXT would be trading at $2.7 after experiencing a massive surge by the end of 2028.
Orchid (OXT) Price Prediction 2029
2029 is expected to be another bull run due to the aftermath of the BTC halving. However, traders speculate that the crypto market would gradually become stable by this year. In tandem with the stable market sentiment and the slight price surge expected after the aftermath, OXT could be trading at $3 by the end of 2029.
Orchid (OXT) Price Prediction 2030
After witnessing a bullish run in the market, OXT and many altcoins would show signs of consolidation and might trade sideways for some time while experiencing minor spikes. Therefore, by the end of 2030, OXT could be trading at $3.2.
Orchid (OXT) Price Prediction 2040
The long-term forecast for OXT indicates that this altcoin could reach a new all-time high(ATH). This would be one of the key moments as HODLERS may expect to sell some of their tokens at the ATH point. However, OXT may face a slight fall before starting its upward journey once again. It is expected that the price of OXT could reach $11 by 2040.
| Minimum Price | Average Price | Maximum Price |
| 9.56 | 10.47 | 11.37 |
Orchid (OXT)Price Prediction 2050
The community believes that there will be widespread adoption of cryptocurrencies, which could maintain gradual bullish gains. By the end of 2050, if the bullish momentum is maintained, OXT could surpass the resistance level of $26.
| Minimum Price | Average Price | Maximum Price |
| 24.18 | 25.72 | 26.01 |
Conclusion
To summarize, if investors continue to show interest in OXT and add these tokens to their portfolio, then, it could continue to rise up. OXT’s bullish price prediction shows that it could pass beyond the $0.7 level. Moreover, OXT could surpass the $26 level by the end of 2050.
FAQ
Orchid defines itself as a decentralized virtual private network (VPN) allowing users to buy bandwidth from a decentralized pool of service providers. The native token of Orchid could empower and secure this new approach to VPN service and is one of the core components of the Orchid network.
OXT can be traded on many exchanges like other digital assets in the crypto world. Binance, KuCoin, Coinbase, Kraken, OKX, and Gate.io are currently popular exchanges for trading OXT.
OXT’s feature is a unique selling point compared to other cryptocurrencies. Moreover, the rising demand for privacy and decentralization could drive the prices of OXT upwards.
OXT achieved its all-time high of $1.02 in 2021.
If investors continue to add OXT into their portfolio, then, OXT has the potential to trade beyond the level of $10 by 2040.
The total supply of OXT is 1,000,000,000 OXT.
OXT can be stored in a cold wallet, hot wallet, or exchange wallet.
OXT is expected to reach $0.4 in 2023.
OXT is expected to reach $1.2 in 2024.
OXT is expected to reach $1.6 in 2025.
OXT is expected to reach $1.8 in 2026.
OXT is expected to reach $2.4 in 2027.
OXT is expected to reach $2.7 in 2028.
OXT is expected to reach $3 in 2029.
OXT is expected to reach $3.2 in 2030.
OXT is expected to reach $11 in 2040.
OXT is expected to reach $26 in 2050.
Disclaimer: The views and opinions, as well as all the information shared in this price prediction, are published in good faith. Readers must do their research and due diligence. Any action taken by the reader is strictly at their own risk. Coin Edition and its affiliates will not be held liable for any direct or indirect damage or loss.
More Crypto Price Predictions:
- Flare (FLR) Price Prediction 2023-2030
- Aptos (APT) Price Prediction 2023-2030
- TRON (TRX) Price Prediction 2023-2030
- Baby Doge Coin Price Prediction 2023-2030
Disclaimer: The information presented in this article is for informational and educational purposes only. The article does not constitute financial advice or advice of any kind. Coin Edition is not responsible for any losses incurred as a result of the utilization of content, products, or services mentioned. Readers are advised to exercise caution before taking any action related to the company.


